Mathematics, 08.06.2020 22:57 ligittiger12806
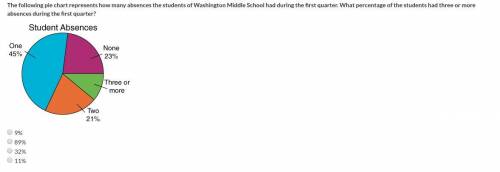
Picture chart is below
The following pie chart represents how many absences the students of Washington Middle School had during the first quarter. What percentage of the students had three or more absences during the first quarter?
Thanks for all correct answers


Answers: 3


Another question on Mathematics

Mathematics, 21.06.2019 15:30
Given the box plot, will the mean or the median provide a better description of the center? box plot with min at 10.5, q1 at 11.5, median at 12.5, q3 at 13.5, max at 15
Answers: 2

Mathematics, 21.06.2019 17:30
The manufacturer of a new product developed the following expression to predict the monthly profit, in thousands of dollars, from sales of the productwhen it is sold at a unit price of x dollars.-0.5x^2 + 22x - 224what is represented by the zero(s) of the expression? a.the profit when the unit price is equal to 0b.the unit price(s) when the profit is equal to 0c.the profit when the unit price is greatestd.the unit price(s) when profit is greatest
Answers: 3


Mathematics, 21.06.2019 19:00
Write a function for a rotation 90 degrees counter clockwise about the origin, point 0
Answers: 1
You know the right answer?
Picture chart is below
The following pie chart represents how many absences the students of Washing...
Questions

Chemistry, 20.08.2021 18:40

History, 20.08.2021 18:40


Social Studies, 20.08.2021 18:40

Biology, 20.08.2021 18:40

English, 20.08.2021 18:40

Mathematics, 20.08.2021 18:40


Mathematics, 20.08.2021 18:40

Mathematics, 20.08.2021 18:40

Mathematics, 20.08.2021 18:40


English, 20.08.2021 18:40

Social Studies, 20.08.2021 18:40

Spanish, 20.08.2021 18:40


