
Mathematics, 10.06.2020 20:57 averiemiranda1
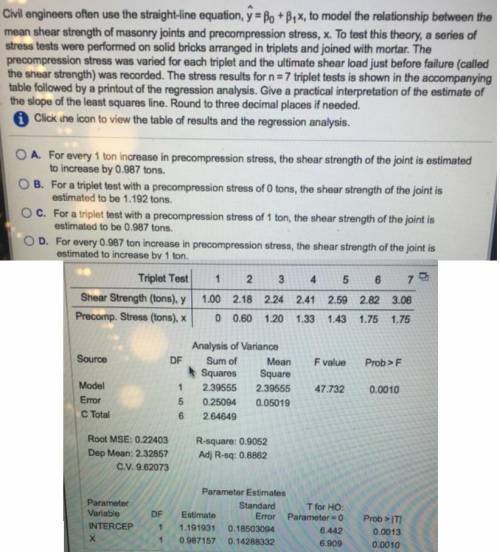
Civil engineers often use the straight-line equation, y Bo +B1x, to model the relationship between the mean shear strength of masonry joints and precompression stress, x. To test this theory, a series of stress tests were performed on solid bricks arranged in triplets and joined with mortar. The precompression stress was varied for each triplet and the ultimate shear load just before failure (called the shear strength) was recorded. The stress results for n 7 triplet tests is shown in the accompanying table followed by a printout of the regression analysis. Give a practical interpretation of the estimate of the slope of the least squares line. Round to three decimal places if needed.
Click the icon to view the table of results and the regression analysis
A. or every 1 ton increase in precompression stress, the shear strength of the joint is estimated to increase by 0.987 tons.
B. For a triplet test with a precompression stress of o tons, the shear strength of the joint is estimated to be 1.192 tons.
C. For a triplet test with a precompression stress of 1 ton, the shear strength of the joint is estimated to be 0.987 tons.
D. For every 0.987 ton increase in precompression stress, the shear strength of the joint is estimated to increase by 1 ton.

Answers: 1


Another question on Mathematics
Mathematics, 21.06.2019 21:00
Asequence has its first term equal to 4, and each term of the sequence is obtained by adding 2 to the previous term. if f(n) represents the nth term of the sequence, which of the following recursive functions best defines this sequence? (1 point) f(1) = 2 and f(n) = f(n − 1) + 4; n > 1 f(1) = 4 and f(n) = f(n − 1) + 2n; n > 1 f(1) = 2 and f(n) = f(n − 1) + 4n; n > 1 f(1) = 4 and f(n) = f(n − 1) + 2; n > 1 i will award !
Answers: 1
Mathematics, 22.06.2019 01:30
Given are five observations for two variables, x and y. xi 1 2 3 4 5 yi 3 7 5 11 14 which of the following is a scatter diagrams accurately represents the data? what does the scatter diagram developed in part (a) indicate about the relationship between the two variables? try to approximate the relationship betwen x and y by drawing a straight line through the data. which of the following is a scatter diagrams accurately represents the data? develop the estimated regression equation by computing the values of b 0 and b 1 using equations (14.6) and (14.7) (to 1 decimal). = + x use the estimated regression equation to predict the value of y when x = 4 (to 1 decimal). =
Answers: 3
Mathematics, 22.06.2019 02:10
Roderick wants to draw a circle for which the numerical value of the circumference is greater than the value of the area.which lengths could he use for the radius? check all that apply
Answers: 2
You know the right answer?
Civil engineers often use the straight-line equation, y Bo +B1x, to model the relationship between t...
Questions

History, 05.10.2019 17:00

Social Studies, 05.10.2019 17:00
History, 05.10.2019 17:00

Biology, 05.10.2019 17:00
Mathematics, 05.10.2019 17:00
Mathematics, 05.10.2019 17:00
Biology, 05.10.2019 17:00
Biology, 05.10.2019 17:00
Mathematics, 05.10.2019 17:00

History, 05.10.2019 17:00

Computers and Technology, 05.10.2019 17:00
Mathematics, 05.10.2019 17:00


