
Mathematics, 10.06.2020 07:57 ceelow
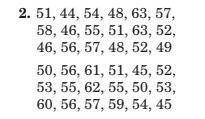
Use a graphing calculator to construct a histogram for the data, and use it to describe the shape of the distribution.

Answers: 1


Another question on Mathematics
Mathematics, 21.06.2019 19:00
Suppose that one doll house uses the 1 inch scale, meaning that 1 inch on the doll house corresponds to 1/2 foot for life-sized objects. if the doll house is 108 inches wide, what is the width of the full-sized house that it's modeled after? in inches and feet.
Answers: 2
Mathematics, 21.06.2019 22:20
An object in geometry with no width, length or height is a(n):
Answers: 1
Mathematics, 21.06.2019 23:00
The equation shown below represents function f. f(x)= -2x+5 the graph shown below represents function g. which of the following statements is true? a. over the interval [2, 4], the average rate of change of f is the same as the average rate of change of g. the y-intercept of function f is less than the y-intercept of function g. b. over the interval [2, 4], the average rate of change of f is greater than the average rate of change of g. the y-intercept of function f is greater than the y-intercept of function g. c. over the interval [2, 4], the average rate of change of f is the same as the average rate of change of g. the y-intercept of function f is greater than the y-intercept of function g. d. over the interval [2, 4], the average rate of change of f is less than the average rate of change of g. the y-intercept of function f is the same as the y-intercept of function g.
Answers: 1
You know the right answer?
Use a graphing calculator to construct a histogram for the data, and use it to
describe the shape o...
Questions
Mathematics, 11.02.2021 22:40

Chemistry, 11.02.2021 22:40


Mathematics, 11.02.2021 22:40


Computers and Technology, 11.02.2021 22:40


