
Mathematics, 12.06.2020 01:57 justhereforanswers13
The following data shows the weekly amounts spent on food for a family of three in a random sample of 30 families:
40 42 46 47 47 48 52 53 53 53
54 56 57 57 57 57 58 58 58 62
62 63 63 63 63 66 67 68 72 73
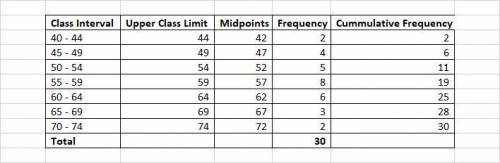
1. Determine the number of classes and the class interval.
2. Group the data into a frequency distribution starting with the lowest value.
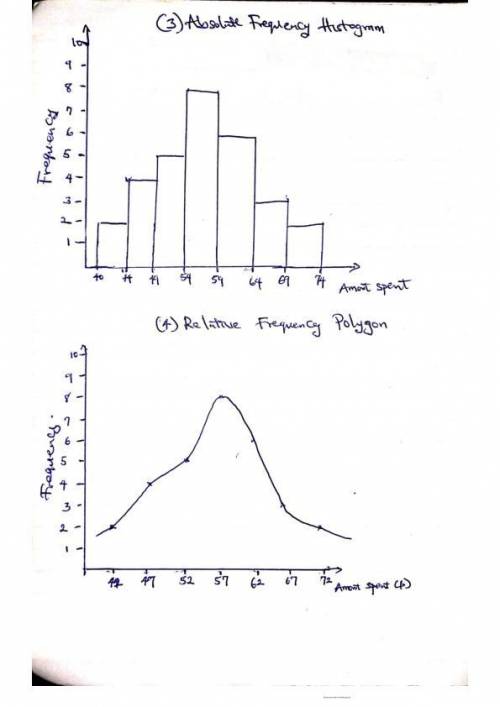
3. Draw an absolute frequency histogram using class limits.
4. Draw a relative frequency polygon for the data using midpoints.
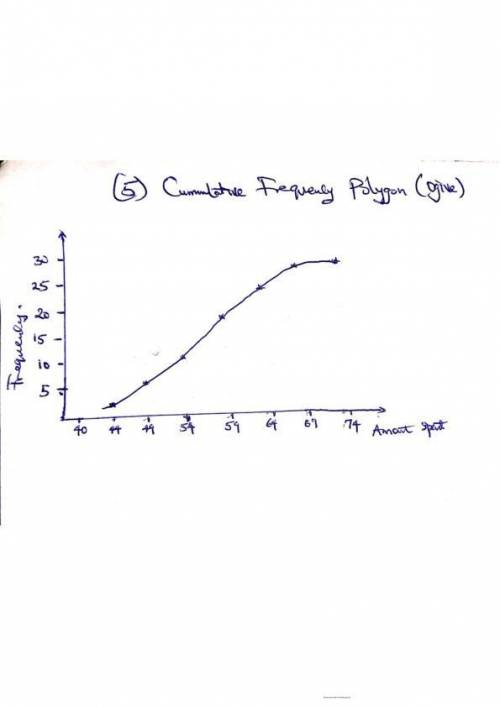
5. Draw a cumulative frequency polygon (ogive) for the data using class limits

Answers: 3


Another question on Mathematics
Mathematics, 21.06.2019 17:00
Rectangle leg this 11feet and perimeter of 38feet what is the width of the rectangle in feet
Answers: 1
Mathematics, 21.06.2019 19:20
Which of the following is the result of expanding the series
Answers: 1
Mathematics, 21.06.2019 21:30
Lizette is training for a marathon. at 7: 00 she left her house and ran until 8: 30, then she walked until 11: 30. she covered a total distance of 18 miles. her running speed was six miles per hour faster than her walking speed. find her running and walking speeds in miles per hour.
Answers: 2
You know the right answer?
The following data shows the weekly amounts spent on food for a family of three in a random sample o...
Questions


English, 18.06.2021 07:10

Computers and Technology, 18.06.2021 07:10

Physics, 18.06.2021 07:10
Mathematics, 18.06.2021 07:10

Social Studies, 18.06.2021 07:10
English, 18.06.2021 07:10
English, 18.06.2021 07:10
Mathematics, 18.06.2021 07:10

History, 18.06.2021 07:10
Mathematics, 18.06.2021 07:10
Mathematics, 18.06.2021 07:10

Biology, 18.06.2021 07:10
Biology, 18.06.2021 07:10
Mathematics, 18.06.2021 07:10
Biology, 18.06.2021 07:10


