2 Points
These dot plots show the lengths (in feet) from a sample of crocodiles and
all...

Mathematics, 11.06.2020 16:02 bloom826
2 Points
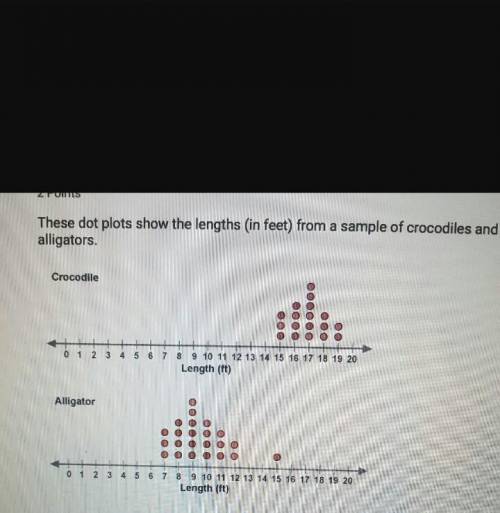
These dot plots show the lengths (in feet) from a sample of crocodiles and
alligators
Crocodi
0 1 2 3 4 5 6 7 8 9 10 11 12 13 14 15 16 17 18 19 20
Alligator
0 1 2 3 4 5 6 7 8 9 10 11 12 13 14 15 16 17 18 19 20
Length
What are the differences between the centers and spreads of these
distributions?
Select two choices: one for the centers and one for the spreads
D A Centers: The crocodiles have a lower median length than the
alligators
B. Centers: The crocodiles have a greater median length than the
alligators
c. Spreads: The lengths of the alligators are more spread out
D. Spreads. The lengths of the crocodiles are more spread out
PREVIOUS
SEO

Answers: 1


Another question on Mathematics
Mathematics, 21.06.2019 15:00
Achemist has 200 ml of a 10% sucrose solution. she adds x ml of a 40% sucrose solution. the percent concentration, y, of the final mixture is given by the rational function: the chemist needs the concentration of the final mixture to be 30%. how many milliliters of the 40% solution should she add to the 10% solution to get this concentration?
Answers: 1
Mathematics, 21.06.2019 23:30
The average daily maximum temperature for laura’s hometown can be modeled by the function f(x)=4.5sin(πx/6)+11.8 , where f(x) is the temperature in °c and x is the month. x = 0 corresponds to january.what is the average daily maximum temperature in may? round to the nearest tenth of a degree if needed.use 3.14 for π .
Answers: 1
Mathematics, 22.06.2019 01:00
The weight of 46 new patients of a clinic from the year 2018 are recorded and listed below. construct a frequency distribution, using 7 classes. then, draw a histogram, a frequency polygon, and an ogive for the data, using the relative information from the frequency table for each of the graphs. describe the shape of the histogram. data set: 130 192 145 97 100 122 210 132 107 95 210 128 193 208 118 196 130 178 187 240 90 126 98 194 115 212 110 225 187 133 220 218 110 104 201 120 183 124 261 270 108 160 203 210 191 180 1) complete the frequency distribution table below (add as many rows as needed): - class limits - class boundaries - midpoint - frequency - cumulative frequency 2) histogram 3) frequency polygon 4) ogive
Answers: 1
You know the right answer?
Questions

English, 09.04.2020 21:01

English, 09.04.2020 21:01
Mathematics, 09.04.2020 21:01

History, 09.04.2020 21:01
English, 09.04.2020 21:01
Mathematics, 09.04.2020 21:01

Mathematics, 09.04.2020 21:01
Mathematics, 09.04.2020 21:01
Mathematics, 09.04.2020 21:01


