
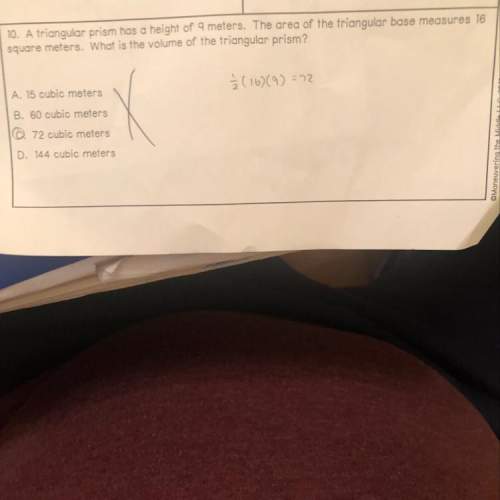
Mathematics, 12.06.2020 17:57 erickcastillo9124
The following is a scatter plot of the heights and weights of the students in Mr. Baldwin’s PE class.
A graph titled Heights and Weights has weight in pounds on the x-axis, and height in inches on the y-axis. A line goes through (146, 47.5) and (173, 72.5).
What is the weight of the student who is 75 inches tall? Does the scatter plot show a positive or negative correlation?
a.
About 191 pounds; negative correlation
b.
About 191 pounds; positive correlation
c.
About 185 pounds; negative correlation
d.
About 185 pounds; positive correlation

Answers: 1


Another question on Mathematics
Mathematics, 21.06.2019 15:50
Create and solve a linear equation that represents the model, where squares and triangles are shown evenly balanced on a balance beam. assume the weight of a square is 1 unit and the weight of a triangle is unknown.
Answers: 3
Mathematics, 21.06.2019 21:00
Hurry if the population of of an ant hill doubles every 10 days and there are currently 100 ants living in the ant hill what will the ant population be in 20 days
Answers: 2
Mathematics, 21.06.2019 21:20
In 2009, there were 1570 bears in a wildlife refuge. in 2010, the population had increased to approximately 1884 bears. if this trend continues and the bear population is increasing exponentially, how many bears will there be in 2018?
Answers: 2
Mathematics, 21.06.2019 22:00
How do you write a paragraph proof to prove that the corresponding angles shown are congruent
Answers: 2
You know the right answer?
The following is a scatter plot of the heights and weights of the students in Mr. Baldwin’s PE class...
Questions

Advanced Placement (AP), 24.03.2021 14:00


History, 24.03.2021 14:00

Physics, 24.03.2021 14:00

Chemistry, 24.03.2021 14:00

English, 24.03.2021 14:00
History, 24.03.2021 14:00
Mathematics, 24.03.2021 14:00
English, 24.03.2021 14:00

English, 24.03.2021 14:00
Mathematics, 24.03.2021 14:00

Mathematics, 24.03.2021 14:00
Mathematics, 24.03.2021 14:00
Mathematics, 24.03.2021 14:00


