
Mathematics, 13.06.2020 01:57 brandonm39
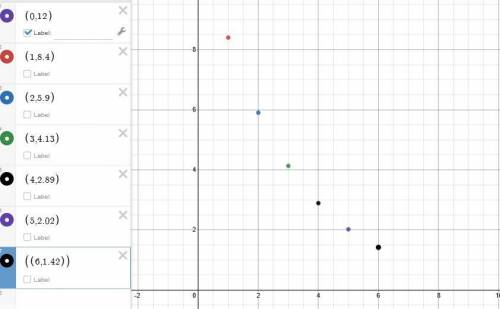
A country commits to decreasing spending for infrastructure in various ways at a rate of 30% per year. At the time of the
announcement, the country is spending $12 billion per year. Which graph models the amount of infrastructure spending
for future years?

Answers: 2


Another question on Mathematics
Mathematics, 21.06.2019 21:00
Deepak plotted these points on the number line. point a: –0.3 point b: – 3 4 point c: – 11 4 point d: –0.7 which point did he plot incorrectly?
Answers: 2
Mathematics, 21.06.2019 23:00
The weight of a radioactive isotope was 96 grams at the start of an experiment. after one hour, the weight of the isotope was half of its initial weight. after two hours, the weight of the isotope was half of its weight the previous hour. if this pattern continues, which of the following graphs represents the weight of the radioactive isotope over time? a. graph w b. graph x c. graph y d. graph z
Answers: 2
Mathematics, 22.06.2019 02:40
Perform the indicated operation and write the answer in the form a + bi. (-5 + 2) + (3 - 6i)
Answers: 3
You know the right answer?
A country commits to decreasing spending for infrastructure in various ways at a rate of 30% per yea...
Questions

Mathematics, 26.02.2020 03:59

English, 26.02.2020 03:59
English, 26.02.2020 04:09
Mathematics, 26.02.2020 04:09


Social Studies, 26.02.2020 04:10

Health, 26.02.2020 04:10
Mathematics, 26.02.2020 04:10


