Mathematics, 13.06.2020 18:57 12monkey6
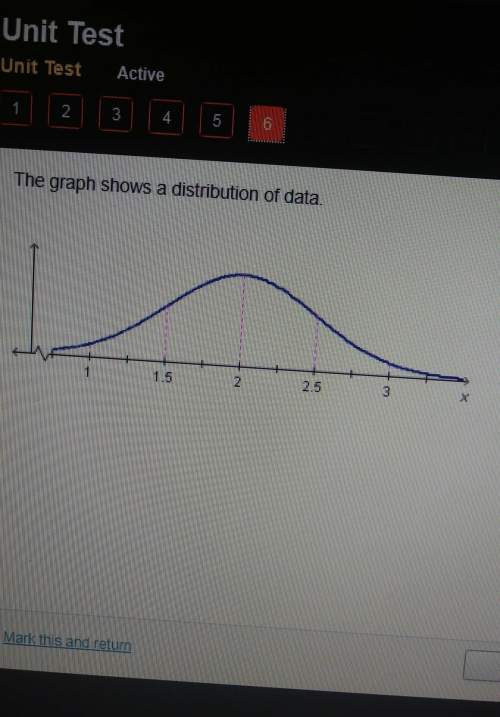
The number of cars running a red light in a day, at a given intersection, possesses a distribution with a mean of 2.92.9 cars and a standard deviation of 55. The number of cars running the red light was observed on 100 randomly chosen days and the mean number of cars calculated. Describe the sampling distribution of the sample mean. A. approximately normal with meanequals=2.92.9 and standard deviationequals=0.50.5 B. shape unknown with meanequals=2.92.9 and standard deviationequals=55 C. approximately normal with meanequals=2.92.9 and standard deviationequals=55 D. shape unknown with meanequals=2.92.9 and standard deviationequals=0.5

Answers: 2


Another question on Mathematics

Mathematics, 21.06.2019 18:30
The final cost of a sale is determined by multiplying the price on the tag by 75%. which best describes the function that represents the situation?
Answers: 1


Mathematics, 21.06.2019 22:40
Ntriangle abc, m∠a = 35° and m∠b = 40°, and a=9. which equation should you solve to find b?
Answers: 2

Mathematics, 21.06.2019 23:30
Hundred and tens tables to make 430 in five different ways
Answers: 1
You know the right answer?
The number of cars running a red light in a day, at a given intersection, possesses a distribution w...
Questions

Mathematics, 26.05.2021 21:50


English, 26.05.2021 21:50

Chemistry, 26.05.2021 21:50

Mathematics, 26.05.2021 21:50

Mathematics, 26.05.2021 21:50


Chemistry, 26.05.2021 21:50

Health, 26.05.2021 21:50

Mathematics, 26.05.2021 21:50


Mathematics, 26.05.2021 21:50


History, 26.05.2021 21:50

History, 26.05.2021 21:50


