4 4

Mathematics, 13.06.2020 23:57 swelch2010
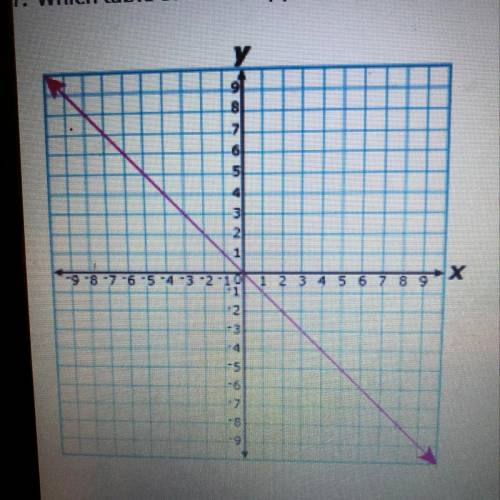
Which table of values appears to have been used to graph the line shown below?
A) X Y
4 4
0 0
-2 -2
B) X Y
-2 2
0 0
-2 -2
C) X Y
-2 2
0 0
2 -2
D) X Y
-2 4
0 0
2 4

Answers: 2


Another question on Mathematics
Mathematics, 21.06.2019 16:20
Which mathematical statements are true? 1) if 3 is an odd number, then 3 times 3 is an even number. 2) if 6 is less than 7, then 4 is greater than 7. 3) six is divisible by 3, and 10 is a multiple of 2. 4) the average of the data is greater than the largest value in the data, or it’s less than the largest value in the data. 5) the slope of a linear graph is its rate of change, and the graph’s y-intercept is the initial value. 6) if an equilateral triangle has equal angles, then all its angles will measure 45°.
Answers: 3
Mathematics, 21.06.2019 18:00
What is the difference between the predicted value and the actual value
Answers: 1
Mathematics, 21.06.2019 20:00
Find all solutions for 2y - 4x =2 y = 2x + 1 site: socratic.org
Answers: 1
Mathematics, 21.06.2019 20:00
Graph the linear function using the slooe and y intercept
Answers: 2
You know the right answer?
Which table of values appears to have been used to graph the line shown below?
A) X Y
4 4
4 4
Questions


Biology, 19.07.2019 12:00
Mathematics, 19.07.2019 12:00
Mathematics, 19.07.2019 12:00
Mathematics, 19.07.2019 12:00
English, 19.07.2019 12:00

Arts, 19.07.2019 12:00
English, 19.07.2019 12:00


