Mathematics, 17.06.2020 01:57 pinapunapula
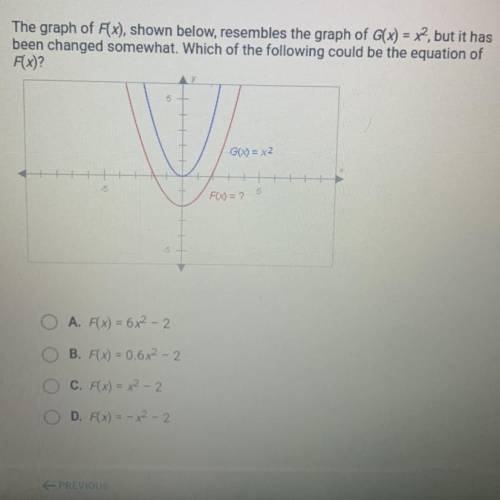
The graph F(x), shown below, resembles the graph of G(x) = x2, but it has been changed somewhat. Which of the following could be the equation of F(x)?


Answers: 1


Another question on Mathematics

Mathematics, 21.06.2019 13:50
Provide an example of a trigonometric function and describe how it is transformed from the standard trigonometric function f(x) = sin x, f(x) = cos x, or f(x) tan x using key features.
Answers: 3

Mathematics, 21.06.2019 20:10
Ascientist has discovered an organism that produces five offspring exactly one hour after its own birth, and then goes on to live for one week without producing any additional offspring. each replicated organism also replicates at the same rate. at hour one, there is one organism. at hour two, there are five more organisms. how many total organisms are there at hour seven? 2,801 19,531 19,607 97.655
Answers: 1

Mathematics, 21.06.2019 21:30
Name and describe the three most important measures of central tendency. choose the correct answer below. a. the mean, sample size, and mode are the most important measures of central tendency. the mean of a data set is the sum of the observations divided by the middle value in its ordered list. the sample size of a data set is the number of observations. the mode of a data set is its highest value in its ordered list. b. the sample size, median, and mode are the most important measures of central tendency. the sample size of a data set is the difference between the highest value and lowest value in its ordered list. the median of a data set is its most frequently occurring value. the mode of a data set is sum of the observations divided by the number of observations. c. the mean, median, and mode are the most important measures of central tendency. the mean of a data set is the product of the observations divided by the number of observations. the median of a data set is the lowest value in its ordered list. the mode of a data set is its least frequently occurring value. d. the mean, median, and mode are the most important measures of central tendency. the mean of a data set is its arithmetic average. the median of a data set is the middle value in its ordered list. the mode of a data set is its most frequently occurring value.
Answers: 3

Mathematics, 21.06.2019 22:00
You can ride your bike around your block 6 times and the whole neighborhood 5 times in 16 minutes. you can ride your bike around your block 3 times and the whole neighborhood 10 times in 23 minutes. how long does it take you to ride around the neighborhood?
Answers: 2
You know the right answer?
The graph F(x), shown below, resembles the graph of G(x) = x2, but it has been changed somewhat. Whi...
Questions

Mathematics, 18.08.2019 09:50


Mathematics, 18.08.2019 09:50

History, 18.08.2019 09:50


Mathematics, 18.08.2019 09:50


Social Studies, 18.08.2019 09:50

Mathematics, 18.08.2019 09:50

Chemistry, 18.08.2019 09:50

Mathematics, 18.08.2019 09:50


History, 18.08.2019 09:50


