Mathematics, 17.06.2020 07:57 legazzz
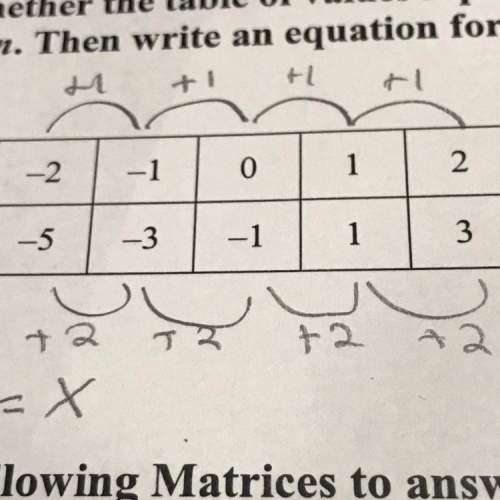
Label axes according to input/output. is the x–axis label. is the y–axis label. 2. Plot the ordered pairs of the independent/dependent variables. The ordered pair is found in the scatter plot.

Answers: 3


Another question on Mathematics

Mathematics, 21.06.2019 19:30
Geometry in the diagram, ∠abc is a right angle. ∠dbc = 30°27'40". find the measure of ∠abd.
Answers: 1

Mathematics, 21.06.2019 19:40
What is the range of the function? f(x)=-2|x+1|? a. all real numbers. b. all real numbers less than or equal to 0. c. all real numbers less than or equal to 1. d. all real numbers greater than or equal to 1
Answers: 2

Mathematics, 21.06.2019 20:00
Compare the following pair of numbers a and b in three ways. a. find the ratio of a to b. b. find the ratio of b to a. c. complete the sentence: a is percent of b. a=120 and b=340 a. the ratio of a to b is . b. the ratio of b to a is . c. a is nothing percent of b.
Answers: 1

Mathematics, 21.06.2019 20:20
How do the number line graphs of the solutions sets of -23 > x and x-23 differ?
Answers: 1
You know the right answer?
Label axes according to input/output. is the x–axis label. is the y–axis label. 2. Plot the ordered...
Questions


English, 24.10.2021 07:50

Mathematics, 24.10.2021 07:50


Physics, 24.10.2021 07:50

Mathematics, 24.10.2021 07:50

History, 24.10.2021 07:50


English, 24.10.2021 07:50


History, 24.10.2021 07:50


History, 24.10.2021 07:50

Mathematics, 24.10.2021 07:50

Mathematics, 24.10.2021 07:50


