
Mathematics, 19.06.2020 03:57 surfskate
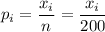
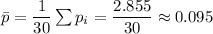
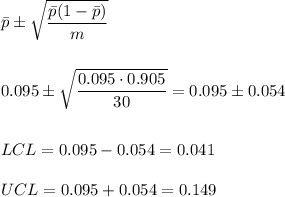
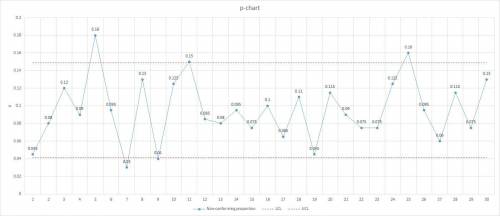
A sample of 200 ROM computer chips was selected on each of 30 consecutive days, and the number of nonconforming chips on each day was as follows: The data has been given so that it can be copied into R as a vector. non. conforming c(9, 16, 24, 18, 36, 19, 6, 26, 8, 25, 30, 17, 16, 19, 15, 20, 13, 22, 9, 23, 18, 15, 15, 25, 32, 19, 12, 23, 15, 26) #Construct a p chart by using the following code. You will need to enter your values for pbar, LCL and UCL. pbar LCL = UCL = plot(non. conforming/200, ylimc(0,.5)) abline(h pbar, Ity 2) abline(h LCL, Ity 3) abline(h UCL, Ity 3) Construct a p chart and examine it for any out-of-control points. (Round your answers to four decimal places.) LCL = UCL = 0.25 0.20 0.15 0.10 0.05 0.00 0.25 0.20 0.15 UCL .UCL LCI 0.05t LCL 0.00 5 10 15 20 25 30 5 10 15 20 25 30 0.25 0.20 0.15 0.10 0.05 0.00 O-0.05 0.25 0.20 0.15 0.10 0.05 o 0.00 UCL UCL LCL LCL 5 10 15 20 25 30 Day 5 10 15 20 25 30
Comment on the chart
A) Most points are between these limits, so the process appears to be in control with respect to variability
B) All points are between these limits, so the process appears to be out of control
C) All points are between these limits, so the process appears to be in control
D) The value of S on the 5th day lies above the UCL, so an out-of-control signal is generated
E) The value of s on the 5th day lies below the LCL, so an out-of-control signal is generated

Answers: 2


Another question on Mathematics
Mathematics, 21.06.2019 15:00
Pick the description of a geometric object that best matches the real world object box for a deck of card
Answers: 1
Mathematics, 21.06.2019 18:40
Aportion of a hiking trail slopes downward at about an 84° angle. to the nearest tenth of a flot, what is the value of x, the distance the hiker traveled along the path, if he has traveled a horizontal distance of 120 feet? a. 143.3 b. 12.5 c. 120.7 d. 130.2
Answers: 1
Mathematics, 21.06.2019 22:00
Which of the following graphs could represent a cubic function?
Answers: 1
You know the right answer?
A sample of 200 ROM computer chips was selected on each of 30 consecutive days, and the number of no...
Questions
Mathematics, 30.11.2020 19:10

English, 30.11.2020 19:10
English, 30.11.2020 19:10

Computers and Technology, 30.11.2020 19:10

Biology, 30.11.2020 19:10


Mathematics, 30.11.2020 19:10
Business, 30.11.2020 19:10


