
Mathematics, 21.06.2020 03:57 zachtsmith2001
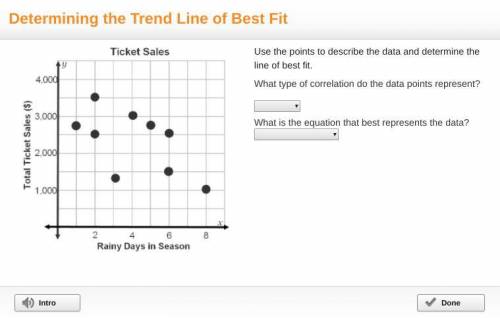
Please help! A graph titled ticket sales has rainy days in season on the x-axis and total ticket sales (dollars) on the y-axis. Points are grouped together and decrease. Points are at (1, 2,800), (2, 2,500), (2, 3,500), (3, 1,400), (4, 3,000), (5, 2,800), (6, 1,500), (6, 2,500), and (8, 1,000). Use the points to describe the data and determine the line of best fit. What type of correlation do the data points represent? What is the equation that best represents the data?

Answers: 2


Another question on Mathematics
Mathematics, 21.06.2019 16:30
Which approach to the theory-and-research cycle does the following sequence reflect: (1) specific observations suggest generalizations, (2) generalizations produce a tentative theory, (3) the theory is tested through the formation of hypotheses, and (4) hypotheses may provide suggestions for additional observations?
Answers: 1
Mathematics, 21.06.2019 22:30
Julie was able to walk 16 km through the zoo in 6 hours. how long will it take her to walk 24 km through the zoo?
Answers: 2
Mathematics, 21.06.2019 23:30
Find each value of the five-number summary for this set of data. [note: type your answers as numbers. do not round.] 150, 120, 136, 180, 158, 175, 124, 162 minimum maximum median upper quartile lower quartile
Answers: 1
Mathematics, 22.06.2019 04:00
If julia has a value of x5.4 that is equivalent to x10.9 true or false. explain
Answers: 3
You know the right answer?
Please help! A graph titled ticket sales has rainy days in season on the x-axis and total ticket sal...
Questions


Computers and Technology, 08.04.2020 17:25


Mathematics, 08.04.2020 17:26

Mathematics, 08.04.2020 17:26
Mathematics, 08.04.2020 17:26
Mathematics, 08.04.2020 17:26


