What is happening to this graph when the x-values are between -8 and -4?
10
-10
5
...

Mathematics, 27.06.2020 09:01 chaseashley24
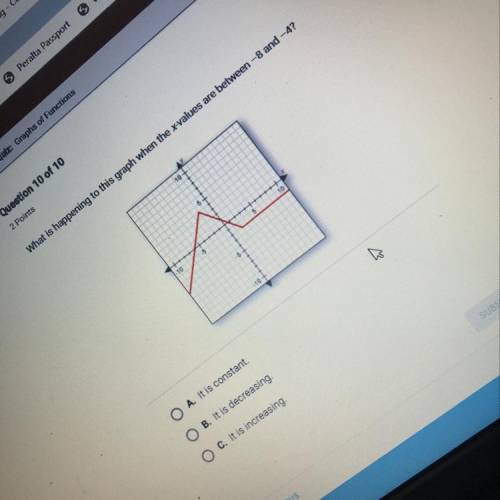
What is happening to this graph when the x-values are between -8 and -4?
10
-10
5
10
10
O A. It is constant.
O B. It is decreasing
O C. It is increasing.

Answers: 2


Another question on Mathematics
Mathematics, 21.06.2019 18:00
What are the equivalent ratios for 24/2= /3= /5.5=108/ = /15
Answers: 1
Mathematics, 21.06.2019 18:00
Which statement about the relative areas of δabc and δxyz is true? the area of δabc > the area of δxyz the area of δabc < the area of δxyz the area of δabc = the area of δxyz more information is needed to compare.
Answers: 2
Mathematics, 21.06.2019 19:00
What is the percentile for data value 6 in the following data set? 4 13 8 6 4 4 13 6 4 13 2 13 15 5 9 4 12 8 6 13 40 25 35 62
Answers: 2
Mathematics, 21.06.2019 22:10
Erinn wrote the equation –5x + 4y = 32 to represent her hourly wage (y) and how this wage has changed during each year that she worked at a company (x). what is the rate of change in erinn's hourly wage per year?
Answers: 2
You know the right answer?
Questions


Mathematics, 10.10.2019 21:00


Geography, 10.10.2019 21:00

Computers and Technology, 10.10.2019 21:00

Physics, 10.10.2019 21:00


