
Mathematics, 27.06.2020 02:01 LuchaPug
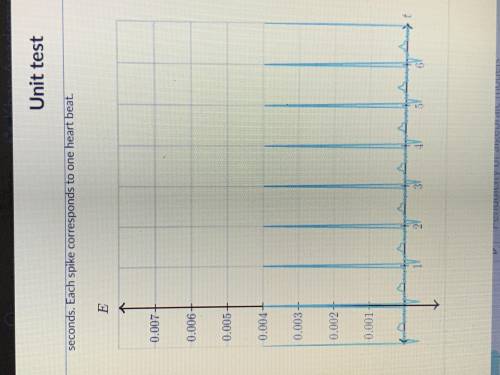
A doctor observes the electrical activity of the heart of a patient over a period of time. The graph below shows the electrical activity, E, in volts, of the patient’s heart over time t, measured in seconds. Each spike corresponds to one heart beat. Approximately how much time is between this patient’s heartbeats?

Answers: 1


Another question on Mathematics
Mathematics, 21.06.2019 19:30
Aproduction manager test 10 toothbrushes and finds that their mean lifetime is 450 hours. she then design sales package of this type of toothbrush. it states that the customers can expect the toothbrush to last approximately 460 hours. this is an example of what phase of inferential statistics
Answers: 1
Mathematics, 21.06.2019 22:00
Jayne is studying urban planning and finds that her town is decreasing in population by 3% each year. the population of her town is changing by a constant rate.true or false?
Answers: 3
Mathematics, 22.06.2019 01:00
First work with stencil one. use a combination of reflections, rotations, and translations to see whether stencil one will overlap with the original pattern. list the sequence of rigid transformations you used in your attempt, noting the type of transformation, the direction, the coordinates, and the displacement
Answers: 3
Mathematics, 22.06.2019 02:00
Reading tests are compared for two students. sara got 98, 100, 65, 78, 98, 46, 100, 100, 45, and 50 on her reading test. lee got 97, 67, 89, 99, 100, 45, 79, 89, 58, and 67 on his reading test.
Answers: 1
You know the right answer?
A doctor observes the electrical activity of the heart of a patient over a period of time. The graph...
Questions
Mathematics, 26.06.2019 05:50

Biology, 26.06.2019 05:50


Mathematics, 26.06.2019 05:50
Mathematics, 26.06.2019 05:50
English, 26.06.2019 05:50
Chemistry, 26.06.2019 05:50
English, 26.06.2019 05:50

History, 26.06.2019 05:50


