
Mathematics, 29.06.2020 20:01 jared3274
Please answer all 3 parts it would help me a lot!:
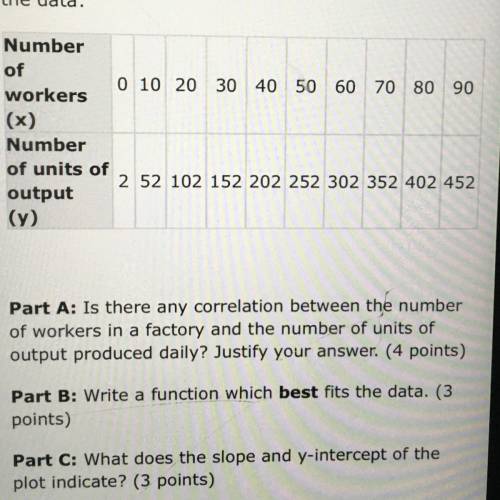
A student is assessing the correlation between the number of workers in a factory and the number of units produced daily. The table shows the data:
GRAPH IS LOCATED IN PICTURES!
Part A: Is there any correlation between the number of workers in a factory and the number of units produced daily? Justify your answer.
Part B: Write a function that best fits the data.
Part C: What does the slope and y-intercept of the plot indicate?
(Give explanations)

Answers: 1


Another question on Mathematics
Mathematics, 21.06.2019 15:30
Gretchen is setting up for a banquet. she has 300 chairs and needs to distribute them evenly among t tables. how many chairs should she put at each table? write your answer as an expression.
Answers: 1
Mathematics, 21.06.2019 19:00
What are the solutions of the equation? z^2 + 11z + 24 = 0 a. 8, -3 b. 8, 3 c. -8, -3 d. -8, 3
Answers: 2
Mathematics, 21.06.2019 20:00
If the discriminant if a quadratic equation is 4 which statement describes the roots?
Answers: 3
Mathematics, 21.06.2019 20:00
Someone answer asap for ! the total ticket sales for a high school basketball game were $2,260. the ticket price for students were $2.25 less than the adult ticket price. the number of adult tickets sold was 230, and the number of student tickets sold was 180. what was the price of an adult ticket?
Answers: 1
You know the right answer?
Please answer all 3 parts it would help me a lot!:
A student is assessing the correlation between t...
Questions
Mathematics, 17.11.2020 19:40

Social Studies, 17.11.2020 19:40


English, 17.11.2020 19:40


Mathematics, 17.11.2020 19:40
Mathematics, 17.11.2020 19:40
Mathematics, 17.11.2020 19:40
Mathematics, 17.11.2020 19:40
Mathematics, 17.11.2020 19:40
English, 17.11.2020 19:40
English, 17.11.2020 19:40
History, 17.11.2020 19:40

Medicine, 17.11.2020 19:40
Mathematics, 17.11.2020 19:40


