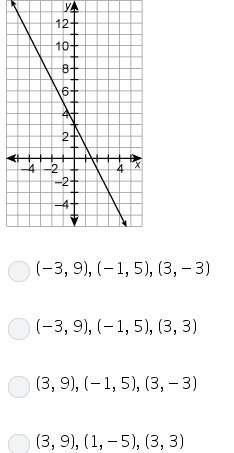
Mathematics, 03.07.2020 18:01 becky060604
Now select the Stats Worksheet. Enter simple formulas in B3 and B4 to pull through the calculated Total Expenditure and Total Net from the Data worksheet (cells X2 and Y2). If you have done it correctly the pie chart should now show how income is proportioned between expenditure and net. QUESTION: According to the pie chart, what percentage of Income is made up by Net? Do not enter the % symbol in the answer box below, just the number.

Answers: 1


Another question on Mathematics

Mathematics, 20.06.2019 18:02
Which is the value of this expression when p=(-2) and q=(-1)
Answers: 1

Mathematics, 21.06.2019 13:40
On any given day, the number of users, u, that access a certain website can be represented by the inequality 1125-4530 which of the following represents the range of users that access the website each day? u> 95 or u < 155 95> u> 155 u< 95 or > 155 95
Answers: 2


Mathematics, 21.06.2019 15:30
Find the number of positive three-digit even integers whose digits are among 9, 8, 7,5, 3, and 1.
Answers: 2
You know the right answer?
Now select the Stats Worksheet. Enter simple formulas in B3 and B4 to pull through the calculated To...
Questions


Social Studies, 06.10.2019 13:00


Health, 06.10.2019 13:00

Health, 06.10.2019 13:00

Advanced Placement (AP), 06.10.2019 13:00


History, 06.10.2019 13:00


Physics, 06.10.2019 13:00


Geography, 06.10.2019 13:00

Social Studies, 06.10.2019 13:00

Mathematics, 06.10.2019 13:00


