
Mathematics, 03.07.2020 21:01 zhangyixing1
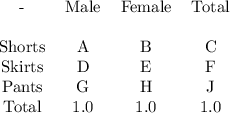
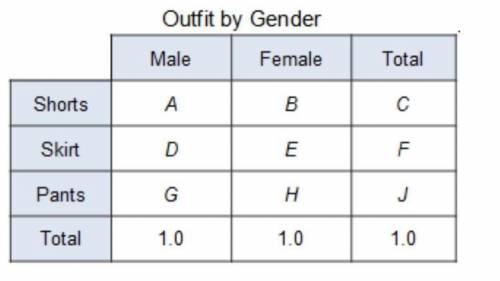
The conditional relative frequency table below was generated by column from a frequency table comparing the gender of a student to what the student chose to wear on a specific day. Which would most likely indicate an association between the categorical variables? The value of G is similar to the value of H. The value of B is similar to the value of E. The value of G is not similar to the value of H. The value of B is not similar to the value of E.

Answers: 2


Another question on Mathematics
Mathematics, 21.06.2019 16:50
Ahiking trail is 6 miles long. it has 4 exercise stations, spaced evenly along the trail. what is the distance between each exercise station?
Answers: 3
Mathematics, 21.06.2019 18:30
Acone with volume 1350 m³ is dilated by a scale factor of 1/3. what is the volume of the resulting cone? enter your answer in the box. m³
Answers: 1
Mathematics, 21.06.2019 22:00
After a dreary day of rain, the sun peeks through the clouds and a rainbow forms. you notice the rainbow is the shape of a parabola. the equation for this parabola is y = -x2 + 36. graph of a parabola opening down at the vertex 0 comma 36 crossing the x–axis at negative 6 comma 0 and 6 comma 0. in the distance, an airplane is taking off. as it ascends during take-off, it makes a slanted line that cuts through the rainbow at two points. create a table of at least four values for the function that includes two points of intersection between the airplane and the rainbow. analyze the two functions. answer the following reflection questions in complete sentences. what is the domain and range of the rainbow? explain what the domain and range represent. do all of the values make sense in this situation? why or why not? what are the x- and y-intercepts of the rainbow? explain what each intercept represents. is the linear function you created with your table positive or negative? explain. what are the solutions or solution to the system of equations created? explain what it or they represent. create your own piecewise function with at least two functions. explain, using complete sentences, the steps for graphing the function. graph the function by hand or using a graphing software of your choice (remember to submit the graph).
Answers: 2
Mathematics, 21.06.2019 23:00
Bobs burgers bam has a special deal of 4 hamburgers for $6. at that rate, how much should it cost to buy 3 hamburgers?
Answers: 1
You know the right answer?
The conditional relative frequency table below was generated by column from a frequency table compar...
Questions


Mathematics, 22.04.2021 01:00
Mathematics, 22.04.2021 01:00
English, 22.04.2021 01:00
Mathematics, 22.04.2021 01:00
Biology, 22.04.2021 01:00
Mathematics, 22.04.2021 01:00


