
Mathematics, 02.07.2020 23:01 rileyjarvis87
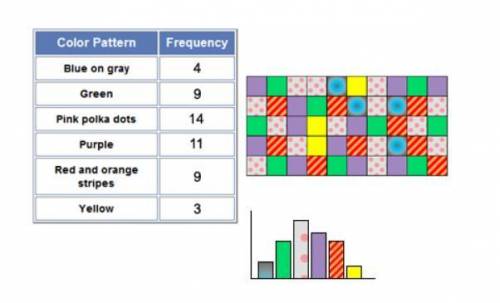
A sample of 50 11th graders were asked to select a favorite pattern out of 6 choices. The data list below shows what their favorite color patterns were, and the accompanying frequency table and bar graph represent these data. In the bar graph, the height of the blue gray bar is 4, the height of the green bar is 9, and so on. Suppose that rather than being just a bar graph, the display you see above is a relative frequency bar graph. The vertical axis of the graph will be marked off in percentages, from 0 percent up to 30 percent. What will be the height of the green bar? A. 18 B. 9 C. 25 D. 15

Answers: 2


Another question on Mathematics
Mathematics, 20.06.2019 18:04
Prove the divisibility of the following numbers: ! i have no any is 1. 16^5 + 2^15 by 33 2. 15^7 + 5^13 by 30
Answers: 1
Mathematics, 21.06.2019 19:00
1) in triangle the, what is the measure of angle t (in degrees)? 2) in triangle bat, the measure of angle b is 66∘, and the measure of angle t is 77∘.what is the measure of the exterior angle at a (in degrees)?
Answers: 1
Mathematics, 21.06.2019 20:00
Consider the set of all four-digit positive integers less than 2000 whose digits have a sum of 24. what is the median of this set of integers?
Answers: 1
You know the right answer?
A sample of 50 11th graders were asked to select a favorite pattern out of 6 choices. The data list...
Questions


Biology, 20.04.2020 21:11

Mathematics, 20.04.2020 21:11


Computers and Technology, 20.04.2020 21:11
Physics, 20.04.2020 21:11

History, 20.04.2020 21:11
Mathematics, 20.04.2020 21:11
Mathematics, 20.04.2020 21:12


