
Mathematics, 04.07.2020 14:01 crazymadhatter0
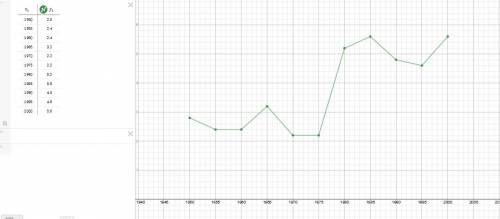
8. The table shows the rate per 1000 population of divorces from 1950 to 2000 at five-year intervals. Plot (Year, Divorces) in a
Cartesian coordinate system, and connect the points with line segments.
Year 1950 1955 1960 1965 1970 1975 1980|1985 1990 1995 2000
Divorces 2.8 | 2.4 | 2.4 | 3.2 2.2 2.2 5.2 5.6 4.8 4.6 5.6
Choose the correct graph below.

Answers: 2


Another question on Mathematics
Mathematics, 21.06.2019 16:40
Find the solutions for a triangle with a =16, c =12, and b = 63º
Answers: 3
Mathematics, 21.06.2019 18:30
Two cyclists 84 miles apart start riding toward each other at the samen time. one cycles 2 times as fast as the other. if they meet 4 hours later what is the speed (in miles) of the faster cyclists
Answers: 2
Mathematics, 21.06.2019 23:00
Graph the system of equations on your graph paper to answer the question. {y=−x+4y=x−2 what is the solution for the system of equations? enter your answer in the boxes.
Answers: 1
Mathematics, 21.06.2019 23:00
If a company produces x units of an item at a cost of $35 apiece the function c=35x is a of the total production costs
Answers: 2
You know the right answer?
8. The table shows the rate per 1000 population of divorces from 1950 to 2000 at five-year intervals...
Questions

Chemistry, 12.05.2021 06:20

Mathematics, 12.05.2021 06:20

English, 12.05.2021 06:20
English, 12.05.2021 06:20
Mathematics, 12.05.2021 06:20

Physics, 12.05.2021 06:20
Mathematics, 12.05.2021 06:30

Mathematics, 12.05.2021 06:30
English, 12.05.2021 06:30


