
Mathematics, 04.07.2020 14:01 Mariela2699
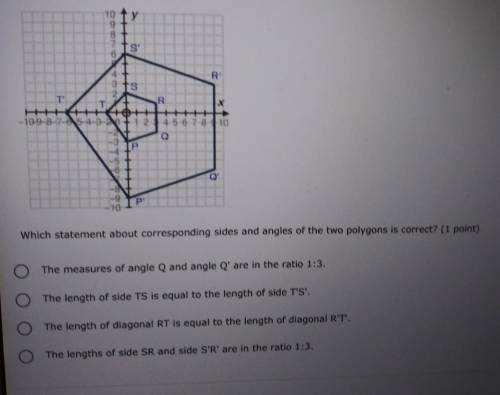
polygon P'Q'R'S'T' shown on the grid below is an image of polygon PQRST after dilation with a scale factor of 3, keeping the origin as the center of dilation:

Answers: 1


Another question on Mathematics
Mathematics, 21.06.2019 15:00
What is the multiplicative rate of change of the exponential function shown on the graph?
Answers: 2
Mathematics, 21.06.2019 18:00
The brain volumes (cm cubed) of 50 brains vary from a low of 904 cm cubed to a high of 1488 cm cubed. use the range rule of thumb to estimate the standard deviation s and compare the result to the exact standard deviation of 175.5 cm cubed, assuming the estimate is accurate if it is within 15 cm cubed
Answers: 2
Mathematics, 21.06.2019 21:00
These box plots show the number of electoral votes one by democratic and republican presidential candidates for the elections from 1984 through 2012. which statement best compares the spread of the data sets
Answers: 2
Mathematics, 21.06.2019 22:00
Find an bif a = {3, 6, 9, 12) and b = {2, 4, 6, 8, 10).
Answers: 1
You know the right answer?
polygon P'Q'R'S'T' shown on the grid below is an image of polygon PQRST after dilation with a scale...
Questions


Computers and Technology, 30.07.2021 05:00


Mathematics, 30.07.2021 05:00
Social Studies, 30.07.2021 05:00
Mathematics, 30.07.2021 05:00


