
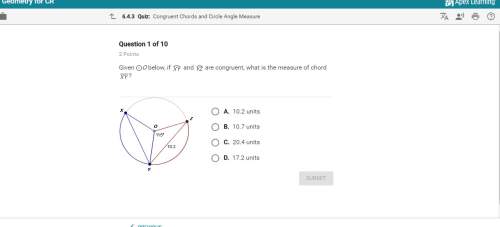
Mathematics, 05.07.2020 14:01 christylam1606
Which inequality does this graph represent? –1 < x –1 Less-than-or-equal-to x x < –1 x Less-than-or-equal-to –1

Answers: 3


Another question on Mathematics
Mathematics, 21.06.2019 19:00
Identify the type of observational study described. a statistical analyst obtains data about ankle injuries by examining a hospital's records from the past 3 years. cross-sectional retrospective prospective
Answers: 2
Mathematics, 21.06.2019 21:10
Which exponential function has an initial value of 2? f(x) = 2(3x) f(x) = 3(2x)
Answers: 1
Mathematics, 21.06.2019 21:50
(x-5)1/2+5=2 what is possible solution of this equation
Answers: 1
Mathematics, 22.06.2019 01:00
X^2/100+y^2/25=1 the length of the major axis is: a)5 b)10 c)20
Answers: 3
You know the right answer?
Which inequality does this graph represent? –1 < x –1 Less-than-or-equal-to x x < –1 x Less-th...
Questions

English, 31.01.2020 12:06

Biology, 31.01.2020 12:06
Mathematics, 31.01.2020 12:06

Mathematics, 31.01.2020 12:06
Mathematics, 31.01.2020 12:06

Computers and Technology, 31.01.2020 12:06
Computers and Technology, 31.01.2020 12:06
English, 31.01.2020 12:06

History, 31.01.2020 12:06
Biology, 31.01.2020 12:43
Mathematics, 31.01.2020 12:43


