
Mathematics, 07.07.2020 14:01 tgeorge95
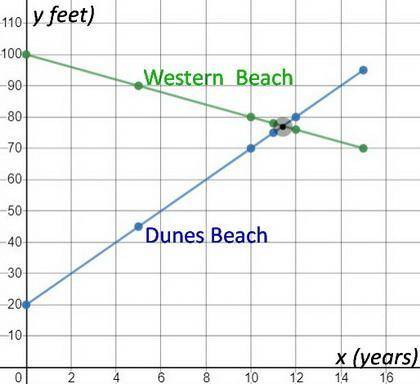
Two ocean beaches are being affected by erosion. The table shows the width, in feet, of each beach measured at high tide where 1995 is represented by year 0: Year number Western Beach width (in feet) Dunes Beach width (in feet) 0 100 20 5 90 45 10 80 70 11 78 75 12 76 80 15 70 95 Describe the patterns shown by the erosion data measurements shown for each of the beaches in the table. Between which years will the beaches have approximately the same width? Assuming these rates remain constant, what can you do to get a better approximation of when the two beaches will have the same width?

Answers: 2


Another question on Mathematics
Mathematics, 21.06.2019 20:00
Hell . what are the solutions to `10x^2 - 38x - 8 = 0`? is this when i find the factors and use the numbers within the factors to determine the zeros? i hope that made sense lol
Answers: 2
Mathematics, 21.06.2019 20:30
Cody was 165cm tall on the first day of school this year, which was 10% taller than he was on the first day of school last year.
Answers: 1
Mathematics, 21.06.2019 22:30
Explain how you could use the interactive table to tell if sets of points are on the same line. math 8
Answers: 2
You know the right answer?
Two ocean beaches are being affected by erosion. The table shows the width, in feet, of each beach m...
Questions


Mathematics, 29.08.2019 13:10

Physics, 29.08.2019 13:10

Health, 29.08.2019 13:10


Biology, 29.08.2019 13:10
Mathematics, 29.08.2019 13:10
English, 29.08.2019 13:10
History, 29.08.2019 13:10

History, 29.08.2019 13:10

Mathematics, 29.08.2019 13:10

World Languages, 29.08.2019 13:10
Mathematics, 29.08.2019 13:10


