
Mathematics, 08.07.2020 09:01 gingerham1
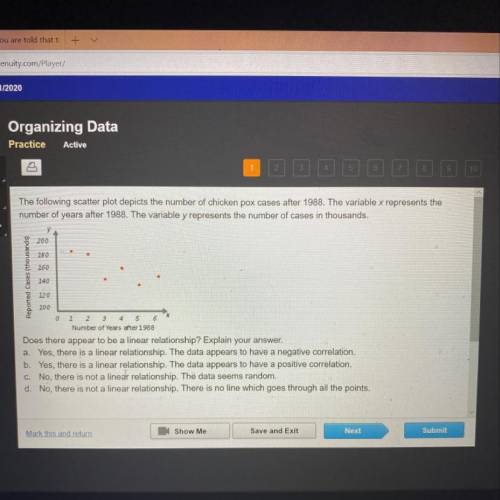
The following scatter plot depicts the number of chicken pox cases after 1988. The variable x represents the
number of years after 1988. The variable y represents the number of cases in thousands.
200
280
260
Reported Cases (thousands)
140
220
4
200
0 2 2 3 5 6
Number of years after 1988
Does there appear to be a linear relationship? Explain your answer.
a. Yes, there is a linear relationship. The data appears to have a negative correlation.
b. Yes, there is a linear relationship. The data appears to have a positive correlation.
C. No, there is not a linear relationship. The data seems random.
d. No, there is not a linear relationship. There is no line which goes through all the points.

Answers: 1


Another question on Mathematics
Mathematics, 21.06.2019 21:20
Find the missing variable for a parallelogram: a = latex: 28in^2 28 i n 2 h = b = 6.3 in (1in=2.54cm)
Answers: 3
Mathematics, 21.06.2019 21:30
Mon wants to make 5 lbs of the sugar syrup. how much water and how much sugar does he need… …to make 5% syrup?
Answers: 2
Mathematics, 21.06.2019 21:30
In a test for esp (extrasensory perception), the experimenter looks at cards that are hidden from the subject. each card contains either a star, a circle, a wave, a cross or a square.(five shapes) as the experimenter looks at each of 20 cards in turn, the subject names the shape on the card. when the esp study described above discovers a subject whose performance appears to be better than guessing, the study continues at greater length. the experimenter looks at many cards bearing one of five shapes (star, square, circle, wave, and cross) in an order determined by random numbers. the subject cannot see the experimenter as he looks at each card in turn, in order to avoid any possible nonverbal clues. the answers of a subject who does not have esp should be independent observations, each with probability 1/5 of success. we record 1000 attempts. which of the following assumptions must be met in order to solve this problem? it's reasonable to assume normality 0.8(1000), 0.2(1000)%30 approximately normal 0.8(1000), 0.2(1000)% 10 approximately normal srs it is reasonable to assume the total number of cards is over 10,000 it is reasonable to assume the total number of cards is over 1000
Answers: 1
You know the right answer?
The following scatter plot depicts the number of chicken pox cases after 1988. The variable x repres...
Questions


Mathematics, 18.10.2019 13:20


Chemistry, 18.10.2019 13:20
Chemistry, 18.10.2019 13:20
Chemistry, 18.10.2019 13:20


French, 18.10.2019 13:20
Mathematics, 18.10.2019 13:20
History, 18.10.2019 13:20
History, 18.10.2019 13:20


Social Studies, 18.10.2019 13:20


