
Mathematics, 14.07.2020 20:01 mgaud2786
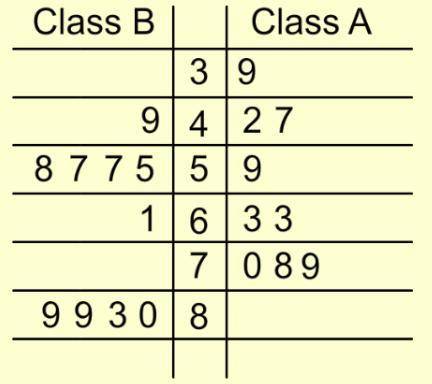
the diagram below show the test scores of two classes of students: Q1. how many students took the test altogether Q2. what is the median score of class B Q3. what was the modal score of class A Q4. what was the range of scores in class B please can you answer

Answers: 3


Another question on Mathematics
Mathematics, 21.06.2019 16:00
Given right triangle xyz, which correctly describes the locations of the sides in relation to
Answers: 1
Mathematics, 21.06.2019 16:30
Scott harris can invest $7,000 in a 1-year cd that earns interest at an annual rate of 4 percent compounded monthly. the amount per $1.00 is 1.040742. he can also invest $7,000 in a 1-year cd at annual rate of 4 percent compounded quarterly. the amount per $1.00 is 1.040604. what is the difference in the amount of interest earned for each investment? a) $0.96 b) $0.81 c) $0.87 d) $0.88
Answers: 1
Mathematics, 21.06.2019 17:30
Apublic library wants to place 4 magazines and 9 books on each display shelf. the expression 4s+9s represents the total number of items that will be displayed on s shelves. simplify the expression
Answers: 2
Mathematics, 21.06.2019 23:30
Katie wants to collect over 100 seashells. she already has 34 seashells in her collection. each day, she finds 12 more seashells on the beach. katie can use fractions of days to find seashells. write an inequality to determine the number of days, dd, it will take katie to collect over 100 seashells.
Answers: 1
You know the right answer?
the diagram below show the test scores of two classes of students: Q1. how many students took the te...
Questions


Computers and Technology, 22.04.2020 02:35


Spanish, 22.04.2020 02:35


