
Mathematics, 13.07.2020 20:01 glendaward8233
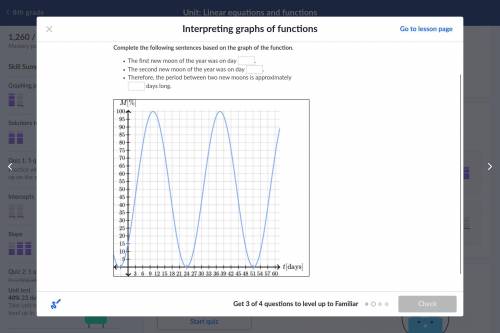
The graph below describes the cycles of the Moon as observed from Earth during the first 60 days of a year. The percentage of the Moon which we see varies as a function of time. A full moon corresponds to 100% percent visibility and a new moon corresponds to 0%, percent visibility.

Answers: 2


Another question on Mathematics
Mathematics, 21.06.2019 15:40
The data represents the semester exam scores of 8 students in a math course. {51,91,46,30,36,50,73,80} what is the five-number summary?
Answers: 1
Mathematics, 21.06.2019 16:00
If myesha works overtime, she gets paid "time and a half" for every hour she works. in other words, for every hour over 40 hours myesha works each week, she gets her hourly pay plus half her hourly pay. what is myesha's pay per hour when she works overtime?
Answers: 1
Mathematics, 22.06.2019 03:50
Gigi earned $65 for 5 hours of gardening. she earned $90 for 9 hours of office work. which statement correctly compares gigi’s earning per hour for gardening and office work? she earned $3 more per hour for office work than for gardening. she earned $4 more per hour for office work than for gardening. she earned $3 more per hour for gardening than for office work. she earned $4 more per hour for gardening than for office work.
Answers: 1
You know the right answer?
The graph below describes the cycles of the Moon as observed from Earth during the first 60 days of...
Questions


Geography, 21.09.2019 21:30

English, 21.09.2019 21:30


Chemistry, 21.09.2019 21:30

Mathematics, 21.09.2019 21:30

Mathematics, 21.09.2019 21:30
Mathematics, 21.09.2019 21:30


