
Mathematics, 13.07.2020 23:01 angelinamadriga
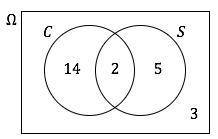
The Venn diagram below shows the numbers of students in a class who had curry (C) and salad (S) at lunch. A student is chosen at random. Find P(C U S)

Answers: 3


Another question on Mathematics
Mathematics, 21.06.2019 14:00
When drawing a trend line for a series of data on a scatter plot, which of the following is true? a. there should be an equal number of data points on either side of the trend line. b. all the data points should lie on one side of the trend line. c. the trend line should not intersect any data point on the plot. d. the trend line must connect each data point on the plot.
Answers: 2
Mathematics, 21.06.2019 14:50
Simplify 4 square root of 2 end root plus 7 square root of 2 end root minus 3 square root of 2 . (1 point) 2 square root of 8 8 square root of 2 8 square root of 6 6 square root of 8
Answers: 1
Mathematics, 21.06.2019 16:30
An equation where variables are used to represent known values—function notation true or false
Answers: 2
You know the right answer?
The Venn diagram below shows the numbers of students in a class who had curry (C) and salad (S) at l...
Questions


Biology, 13.11.2019 03:31
Mathematics, 13.11.2019 03:31
English, 13.11.2019 03:31
Mathematics, 13.11.2019 03:31

Mathematics, 13.11.2019 03:31
Mathematics, 13.11.2019 03:31
Mathematics, 13.11.2019 03:31
Mathematics, 13.11.2019 03:31


