Mathematics, 15.07.2020 01:01 teddybear8728
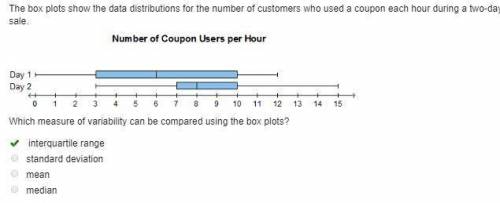
box plots show the data distributions for the number of customers who used a coupon each hour during a two-day sale. Which measure of variability can be compared using the box plots? interquar

Answers: 2


Another question on Mathematics

Mathematics, 21.06.2019 19:50
Prove (a) cosh2(x) − sinh2(x) = 1 and (b) 1 − tanh 2(x) = sech 2(x). solution (a) cosh2(x) − sinh2(x) = ex + e−x 2 2 − 2 = e2x + 2 + e−2x 4 − = 4 = . (b) we start with the identity proved in part (a): cosh2(x) − sinh2(x) = 1. if we divide both sides by cosh2(x), we get 1 − sinh2(x) cosh2(x) = 1 or 1 − tanh 2(x) = .
Answers: 3

Mathematics, 21.06.2019 22:30
In order to be invited to tutoring or extension activities a students performance 20 point higher or lower than average for the
Answers: 1

Mathematics, 22.06.2019 00:00
Plz hurry finals a paper cup in the shape of an inverted cone is 8 inches tall and has a radius of 1.5 inches. how much water can the cup hold? use 3.14 for pi. round the answer to the nearest tenth. a) 12.6 cubic in. b) 18.8 cubic in. c) 37.7 cubic in. d) 56.5 cubic in.
Answers: 2

Mathematics, 22.06.2019 00:30
Julie multiplies 6.27 by 7 and claims the product is 438.9 .explain without multiplying how you know juliesanswer is not correct.find the correct answer
Answers: 1
You know the right answer?
box plots show the data distributions for the number of customers who used a coupon each hour during...
Questions


History, 27.07.2019 10:00

Social Studies, 27.07.2019 10:00

Computers and Technology, 27.07.2019 10:00


Mathematics, 27.07.2019 10:00


Mathematics, 27.07.2019 10:00


