
Mathematics, 17.07.2020 01:01 logan867
Construction Industry-All Employees (Thousands), 2000-2009 A line graph titled construction industry, all employees (thousands), 2000 to 2009, where the x-axis shows years and the y-axis shows all employees, in thousands. Line starts at 6,750 on January 2000, increases to 6,850 on March 2001, decreases to 6,650 on March 2003, increases to 7,700 on March 2006, stays at 7,700 on January 2007, then decreases to 6,700 on January 2009 and continues to decrease. Construction Industry - Average Hourly Earnings (Dollars), 2000-2009 A line graph titled construction industry, average hourly earnings (dollars), 2000 to 2009, where the x-axis shows years and the y-axis shows average hourly earnings of production workers. Line starts at 17.2 on January 2000, slowly increases to 19.7 on January 2006, then increases more quickly to 20.5 on January 2007 and 22.4 on January 2009. Based on trends displayed in the graphs above, which answer choice represents a likely situation for 2010? a. There will be more than 6.5 million construction employees in 2010, and those employees will have average hourly earnings of $24.00. b. There will be over 6 million construction employees in 2010, and the average hourly earnings will be less than twenty dollars. c. There will be roughly 6 million employees in 2010, and those employees will have average hourly earnings of $22.75. d. There will be over 7.5 million employees in 2010, and those employees will earn, on average, $23.00 per hour. Please select the best answer from the choices provided

Answers: 3


Another question on Mathematics
Mathematics, 21.06.2019 16:50
The rate of decay of a radioactive substance depends upon the amount present initially. the mass y (mg) of the radioactive substance cobalt-60 present in a sample at time t (years) is represented by the exponential equation y=50e −0.1315 t . answer the following questions in complete sentences. 1. how does the exponential equation above compare to the equation for simple interest that is compounded continuously? explain the similarities. 2. what is the initial amount of cobalt-60 in the sample? 2. how much cobalt-60 is left after 8.4 years? show your work. 3. what would be the y-intercept of the graph? what does it represent? 4. after how many years will the amount of cobalt-60 left be 6.25 mg? explain what happens to the cobalt-60 after 50 years? 5. discuss some “real-world” examples and uses of cobalt-60
Answers: 1
Mathematics, 21.06.2019 18:00
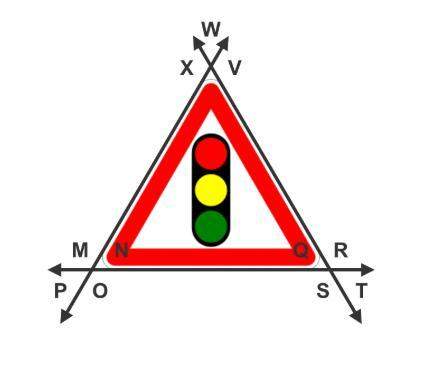
What is the measure of the smallest angle in the diagram? 15 29 32 45
Answers: 2
Mathematics, 21.06.2019 18:00
Lydia collected two sets of data one set of data shows an outlier. which set has an outlier, and which number is the outlier?
Answers: 2
Mathematics, 21.06.2019 19:10
Aline that intersects one of two parallel lines intersects the other also always sometimes never
Answers: 3
You know the right answer?
Construction Industry-All Employees (Thousands), 2000-2009 A line graph titled construction industry...
Questions


Chemistry, 14.11.2019 01:31


History, 14.11.2019 01:31
Business, 14.11.2019 01:31
Mathematics, 14.11.2019 01:31
Mathematics, 14.11.2019 01:31
Biology, 14.11.2019 01:31


Health, 14.11.2019 01:31
Biology, 14.11.2019 01:31
Biology, 14.11.2019 01:31
English, 14.11.2019 01:31


