Mathematics, 17.07.2020 01:01 nisha87
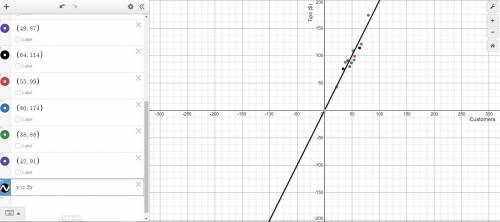
You and your business partner track the number of customers served and the amount of tips collected per day. The data you gathered is displayed in the chart below. Servers’ Collected Tips Customers 54 46 34 67 52 22 49 64 55 80 38 42 Tips ($) $92 $80 $76 $121 $109 $43 $87 $114 $99 $174 $88 $91 a) Create a scatterplot displaying the data in the table. Be sure to include a linear trend line

Answers: 2


Another question on Mathematics

Mathematics, 21.06.2019 20:30
Someone answer asap for ! michele pushes a box d meters across a floor. she uses a force f, in newtons, to push the box. she pushes the box for t seconds. the formula p = fd/t calculates the power, p, in watts, that it takes for michele to complete the task. solve the formula for d.
Answers: 2


Mathematics, 22.06.2019 01:30
Amayoral candidate would like to know her residents’ views on a public open space before the mayoral debates. she asks only the people in her office. her co-workers are an example of a census population convenience sample simple random sample
Answers: 1

Mathematics, 22.06.2019 02:20
Use the second shift theorem to find the inverse laplace transform of (e^−3s) / (s^2 + 2s − 3)
Answers: 1
You know the right answer?
You and your business partner track the number of customers served and the amount of tips collected...
Questions

Mathematics, 30.03.2022 09:20

SAT, 30.03.2022 09:20


English, 30.03.2022 09:30


English, 30.03.2022 09:30


Chemistry, 30.03.2022 09:40


Mathematics, 30.03.2022 09:40


Mathematics, 30.03.2022 09:50

Computers and Technology, 30.03.2022 14:00

Mathematics, 30.03.2022 14:00

Mathematics, 30.03.2022 14:00


