3. Lee la información, luego, usa el gráfico para hallar las probabilidades que se indican.
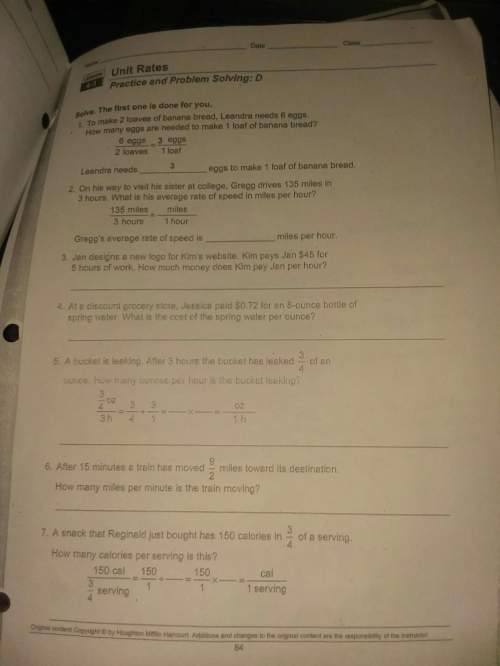
.
...

Mathematics, 19.07.2020 01:01 tay3783
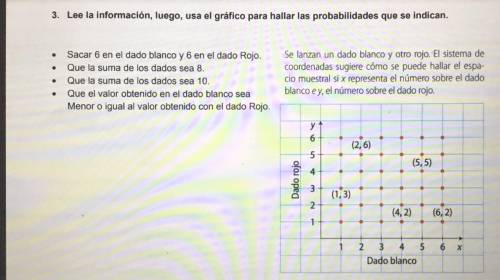
3. Lee la información, luego, usa el gráfico para hallar las probabilidades que se indican.
.
• Sacar 6 en el dado blanco y 6 en el dado Rojo.
Que la suma de los dados sea 8.
Que la suma de los dados sea 10.
Que el valor obtenido en el dado blanco sea
Menor o igual al valor obtenido con el dado Rojo.
Se lanzan un dado blanco y otro rojo. El sistema de
coordenadas sugiere cómo se puede hallar el espa-
cio muestral si x representa el número sobre el dado
blanco e y, el número sobre el dado rojo.
.
у
6
(2,6)
5
(5,5)
4
Dado rojo
(1,3)
3
2
1
(4,2)
(6,2)
1
2
5
6
X
3
Dado blanco

Answers: 2


Another question on Mathematics
Mathematics, 21.06.2019 20:30
Ateam has p points. p = 3w + d w = wins d = draws a) a football team has 5 wins and 3 draws. how many points does the team have?
Answers: 1
Mathematics, 21.06.2019 23:00
How many heads would you expect if you flipped a coin twice? first, fill in the table below with the correct probabilities. hint: the sample space for flipping a coin twice is {hh, ht, th, tt}. a = b = c = f
Answers: 1
Mathematics, 21.06.2019 23:30
Consider the input and output values for f(x) = 2x - 3 and g(x) = 2x + 7. what is a reasonable explanation for different rules with different input values producing the same sequence?
Answers: 1
You know the right answer?
Questions

History, 24.02.2021 19:30
Mathematics, 24.02.2021 19:30
History, 24.02.2021 19:30

Chemistry, 24.02.2021 19:30


Mathematics, 24.02.2021 19:30
Chemistry, 24.02.2021 19:30
Mathematics, 24.02.2021 19:30

Social Studies, 24.02.2021 19:30


