
Mathematics, 21.07.2020 08:01 danetth18
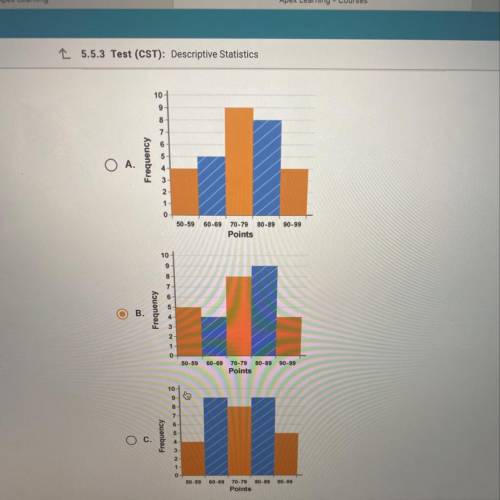
The frequency table shows the number of points scored during 30 Bulldogs
basketball games. On a piece of paper, draw a histogram to represent the
data. Then determine which answer choice matches the histogram you drew.
Points scored
Frequency
50 - 59
4
60 - 69
5
70 - 79
9
80 - 89
8
90 - 99
4
There is one more graph but I couldn’t fit it in the picture, if none of these seem right then it is probably that one.

Answers: 2


Another question on Mathematics
Mathematics, 21.06.2019 14:30
The la dodgers hit the most homeruns in 2014. the number of homeruns accounted for 6% of the entire major leauge baseball homerun count. if 583 total homeruns were hit, approximately how many did the la dodgers hit
Answers: 1
Mathematics, 21.06.2019 18:00
Me, the vertices of quadrilateral coat are c(2,0), o(7,0), a(7,2) and t(2,2). prove that coat is a rectangle.
Answers: 3
Mathematics, 21.06.2019 20:30
For the quadratic function [tex]y=(x+4)^2-1[/tex] , do the following: a) rewrite the function in the standard form, b) rewrite the function in intercept form, c) find the vertex, d) find the y-intercept, e) find the x-intercepts.
Answers: 1
Mathematics, 21.06.2019 23:30
Dawn is selling her mp3 player for 3 4 of the original price. the original price for the mp3 player was $40. how much is she selling her mp3 player for?
Answers: 1
You know the right answer?
The frequency table shows the number of points scored during 30 Bulldogs
basketball games. On a pie...
Questions

History, 30.06.2019 20:00

Mathematics, 30.06.2019 20:00


Geography, 30.06.2019 20:00
English, 30.06.2019 20:00
English, 30.06.2019 20:00
Mathematics, 30.06.2019 20:00

Biology, 30.06.2019 20:00
English, 30.06.2019 20:00
Mathematics, 30.06.2019 20:00
Mathematics, 30.06.2019 20:00
Physics, 30.06.2019 20:00
Mathematics, 30.06.2019 20:00
Mathematics, 30.06.2019 20:00


