
Mathematics, 23.07.2020 06:01 jangk
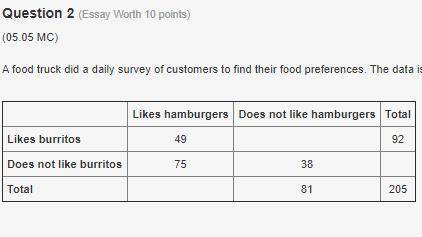
A food truck did a daily survey of customers to find their food preferences. The data is partially entered in the frequency table. Complete the table to analyze the data and answer the questions:
Likes hamburgers Does not like hamburgers
Total Likes burritos 49 92
Does not like burritos 75 38
Total 81 205
- Part A: What percentage of the survey respondents did not like either hamburgers or burritos? (2 points)
- Part B: Create a relative frequency table and determine what percentage of students who like hamburgers also like burritos. (3 points)
- Part C: Use the conditional relative frequencies to determine which data point has strongest association of its two factors. Use complete sentences to explain your answer. (5 points)

Answers: 1


Another question on Mathematics
Mathematics, 21.06.2019 16:00
Ernest is purchasing a $175,000 home with a 30-year mortgage. he will make a $15,000 down payment. use the table below to find his monthly pmi payment.
Answers: 2
Mathematics, 21.06.2019 18:10
Drag the tiles to the boxes to form correct pairs. not all tiles will be used. match each set of vertices with the type of quadrilateral they form
Answers: 3
Mathematics, 21.06.2019 22:30
Collin did the work to see if 10 is a solution to the equation r/4=2.4
Answers: 1
Mathematics, 22.06.2019 01:00
How many zeros does this polynomial function, y=(x-8)(x+3)^2
Answers: 1
You know the right answer?
A food truck did a daily survey of customers to find their food preferences. The data is partially e...
Questions
Mathematics, 20.04.2020 04:18


Mathematics, 20.04.2020 04:18
Biology, 20.04.2020 04:18
Mathematics, 20.04.2020 04:18


Spanish, 20.04.2020 04:18
Mathematics, 20.04.2020 04:18

Chemistry, 20.04.2020 04:18
Mathematics, 20.04.2020 04:18


