
Mathematics, 23.07.2020 02:01 amf14
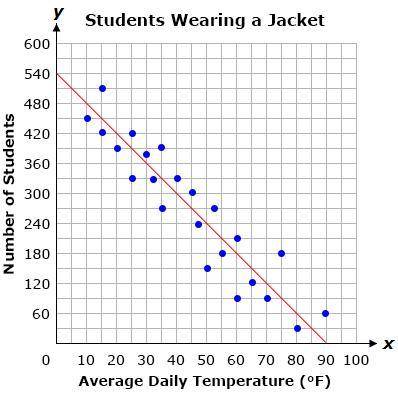
The graph below shows a line of best fit for data collected on the number of students who wear a jacket to school and the average daily temperature in degrees Fahrenheit.
Based on the line of best fit, how many students wear a jacket to school when the temperature is 50°F?
A.) 240
B.) 210
C.) 300
D.) 180

Answers: 3


Another question on Mathematics
Mathematics, 21.06.2019 20:10
Heather is writing a quadratic function that represents a parabola that touches but does not cross the x-axis at x = -6. which function could heather be writing? fx) = x2 + 36x + 12 = x2 - 36x - 12 f(x) = -x + 12x + 36 f(x) = -x? - 12x - 36
Answers: 1
Mathematics, 21.06.2019 22:00
Prove sin2a + cos2a - 1 / sin2a + cos2a + 1 = 1 - tana / 1 + cota
Answers: 2
Mathematics, 22.06.2019 00:10
Which of these would have been most likely to have been a carpetbagger during the reconstruction era? a) a new york businessman who relocated to mississippi b) a former slave who was able to buy land in birmingham c) a carolina-born politician who supported the democratic d) a former confederate officer who owned a farm in memphis eliminate
Answers: 1
Mathematics, 22.06.2019 00:40
Astock has a 25% probability of increasing by $10 and a 75% probability of decreasing by $5. what is the stocks expected increase or decrease?
Answers: 1
You know the right answer?
The graph below shows a line of best fit for data collected on the number of students who wear a jac...
Questions

English, 07.01.2020 07:31

Mathematics, 07.01.2020 07:31
Mathematics, 07.01.2020 07:31

Mathematics, 07.01.2020 07:31

English, 07.01.2020 07:31
History, 07.01.2020 07:31
Mathematics, 07.01.2020 07:31


