Mathematics, 23.07.2020 15:01 Ezonthekid
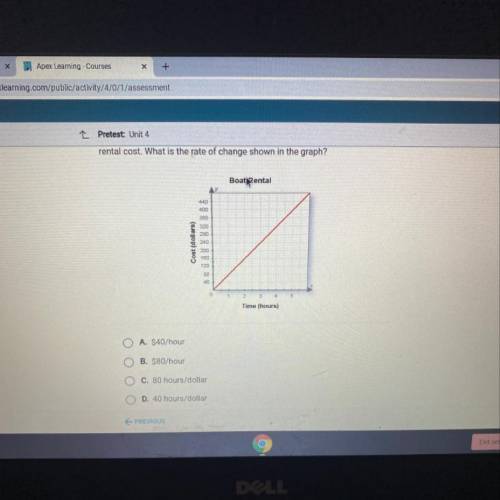
The graph shows how the length of time a boat is rented is related to the
rental cost. What is the rate of change shown in the graph?
Boat Rental
AY
440
400
380
320
Cost (dollars)
240
200
100
120
80
40
0
Time (hours)
A. $40/hour
B. $80/hour
C. 80 hours/dollar
D. 40 hours/dollar


Answers: 2


Another question on Mathematics

Mathematics, 21.06.2019 16:00
You paint a 1/2 of a wall in 1/4 hour. how long will it take you to paint one wall
Answers: 2


Mathematics, 21.06.2019 19:30
Bob is putting books on a shelf and takes a break after filling 18 1/2 inches on the book shelf. the book shelf is now 2/3 full. how long is the entire bookshelf?
Answers: 2

Mathematics, 21.06.2019 19:50
Table which ratio is equivalent to 3: 7? 6: 7 3: 21 24: 56 15: 30
Answers: 1
You know the right answer?
The graph shows how the length of time a boat is rented is related to the
rental cost. What is the...
Questions

Health, 13.07.2019 14:00

Mathematics, 13.07.2019 14:00

Mathematics, 13.07.2019 14:00


Mathematics, 13.07.2019 14:00

Mathematics, 13.07.2019 14:00

Mathematics, 13.07.2019 14:00

Mathematics, 13.07.2019 14:00


Mathematics, 13.07.2019 14:00

Mathematics, 13.07.2019 14:00


Mathematics, 13.07.2019 14:00

Business, 13.07.2019 14:00


