
Mathematics, 28.07.2020 07:01 sunny6946
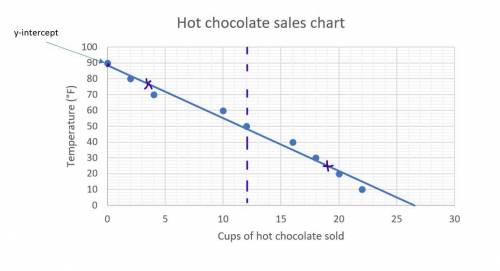
Will give most points(06.02)Jordan plotted the graph below to show the relationship between the temperature of his city and the number of cups of hot chocolate he sold daily
Jordan's Hot Chocolate Sales
22
20
18
16
12
Cups of Hot Chocolate Sold
10
4
2
0 10 20 30 40 50 60 70 80 90
Temperature (°F)
Part A: In your own words, describe the relationship between the temperature of the city and the number of cups of hot chocolate sold. (2 points)
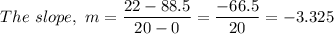
Part B: Describe how you can make the line of best fit. Write the approximate slope and y-intercept of the line of best fit. Show your work, including the point

Answers: 2


Another question on Mathematics
Mathematics, 21.06.2019 14:10
1. during first 10 seconds 2. between 10 seconds and 35 seconds 3. during 35 seconds to 40 seconds
Answers: 1
Mathematics, 21.06.2019 19:30
Your food costs are $5,500. your total food sales are $11,000. what percent of your food sales do the food costs represent?
Answers: 2
Mathematics, 21.06.2019 21:00
Circle d circumscribes abc and abe. which statements about the triangles are true? statement i: the perpendicular bisectors of abc intersect at the same point as those of abe. statement ii: the distance from c to d is the same as the distance from d to e. statement iii: bisects cde. statement iv: the angle bisectors of abc intersect at the same point as those of abe. a. i only b. i and ii c. ii and iv d. i and iii e. iii and iv
Answers: 2
Mathematics, 21.06.2019 21:30
Write 5(6x+4)-2(5x-2) in the form a(bx+c) where a,b and c integers and a> 1
Answers: 1
You know the right answer?
Will give most points(06.02)Jordan plotted the graph below to show the relationship between the temp...
Questions

Computers and Technology, 27.10.2019 23:43


Mathematics, 27.10.2019 23:43

Physics, 27.10.2019 23:43

Mathematics, 27.10.2019 23:43
History, 27.10.2019 23:43


