
Mathematics, 04.08.2020 09:01 hollycoleman13
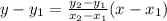
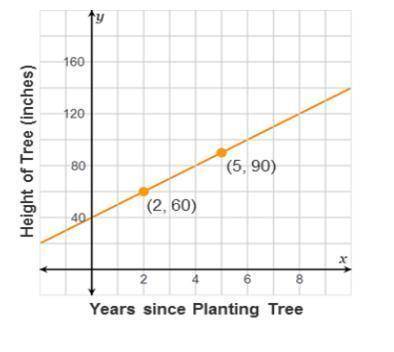
The graph shows the growth of a tree with
representing the number of years since it was allanted
and y representing the trees het mees Use the
graph to analyze the trees growth. Sellest alltaf sly
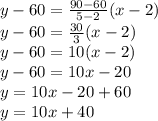
The tree was 40 metes taill when planted
The tree's growth rate is 10 mees per year
The tree was 2 years old when planted
As it ages, the trees growth rate shows
Ten years after planting, is 14 inches tall

Answers: 2


Another question on Mathematics
Mathematics, 21.06.2019 18:40
Christina can paint 420 square feet in 105 minutes. which unit rate describes the scenario?
Answers: 1
Mathematics, 21.06.2019 19:30
Bobby bought 1.12 pounds of turkey at a cost of 2.50 per pound. carla bought 1.4 pounds of turkey at a cost of 2.20 per pound. who spent more and by much?
Answers: 2
Mathematics, 21.06.2019 21:30
Acoffee shop orders at most $3,500 worth of coffee and tea. the shop needs to make a profit of at least $1,900 on the order. the possible combinations of coffee and tea for this order are given by this system of inequalities, where c = pounds of coffee and t = pounds of tea: 6c + 13t ≤ 3,500 3.50c + 4t ≥ 1,900 which graph's shaded region represents the possible combinations of coffee and tea for this order?
Answers: 1
Mathematics, 21.06.2019 22:00
If i had 1234 apples and 1 banana what is the total amount
Answers: 2
You know the right answer?
The graph shows the growth of a tree with
representing the number of years since it was allanted
Questions
Mathematics, 07.11.2021 14:00


Arts, 07.11.2021 14:00

Computers and Technology, 07.11.2021 14:00


History, 07.11.2021 14:00
History, 07.11.2021 14:00
Mathematics, 07.11.2021 14:00
Mathematics, 07.11.2021 14:00


