
Mathematics, 03.08.2020 14:01 adrian08022
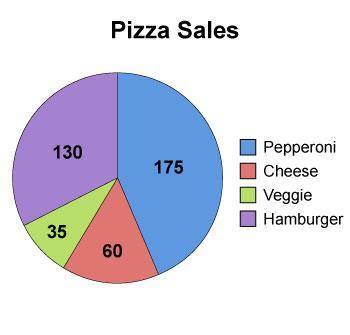
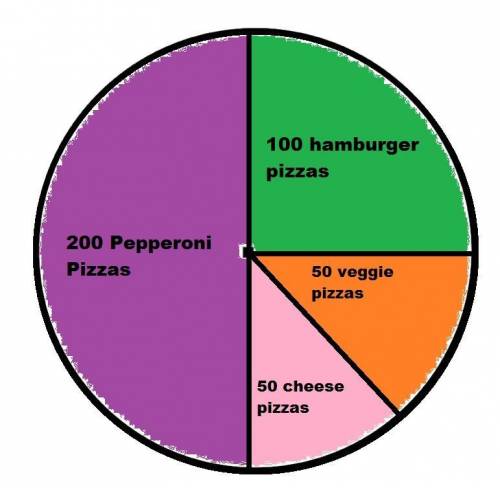
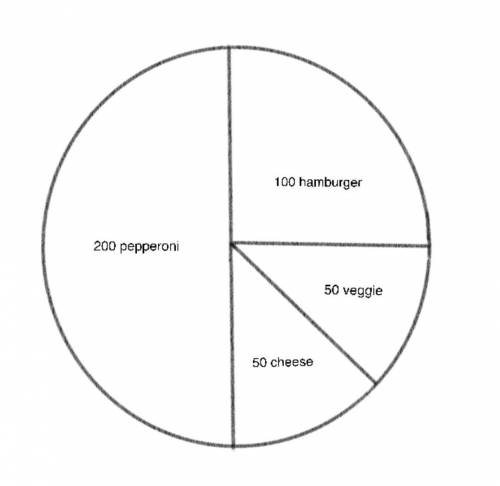
100 POINTS!The number of pizzas sold in one weekend at Pete's Pizzas is shown. Pie chart of pizza sales. Data includes: 130 hamburger, 175 pepperoni, 60 cheese, and 35 veggie. a) If Pete's sales remain consistent, how many pepperoni pizzas will he have sold when the total number of pizzas sold reaches 1600? b) How would the circle graph be different if Pete had sold 200 pepperoni pizzas, 100 hamburger pizzas, 50 veggie pizzas, and 50 cheese pizzas?

Answers: 1


Another question on Mathematics
Mathematics, 21.06.2019 18:40
Acircle has a circumference of 28.36 units what is the diameter of the circle
Answers: 2
Mathematics, 21.06.2019 21:00
Sue's average score for three bowling games was 162. in the second game, sue scored 10 less than in the first game. in the third game, she scored 13 less than in the second game. what was her score in the first game?
Answers: 2
Mathematics, 21.06.2019 23:00
Someone answer this asap for the function f(x) and g(x) are both quadratic functions. f(x) = x² + 2x + 5 g(x) = x² + 2x - 1 which statement best describes the graph of g(x) compared to the graph of f(x)? a. the graph of g(x) is the graph of f(x) shifted down 1 units. b. the graph of g(x) is the graph of f(x) shifted down 6 units. c. the graph of g(x) is the graph of f(x) shifted to the right 1 unit. d. the graph of g(x) is the graph of f(x) shifted tothe right 6 units.
Answers: 3
You know the right answer?
100 POINTS!The number of pizzas sold in one weekend at Pete's Pizzas is shown. Pie chart of pizza sa...
Questions


Computers and Technology, 10.03.2020 04:39


History, 10.03.2020 04:40


