
Mathematics, 03.08.2020 16:01 bkimswift7
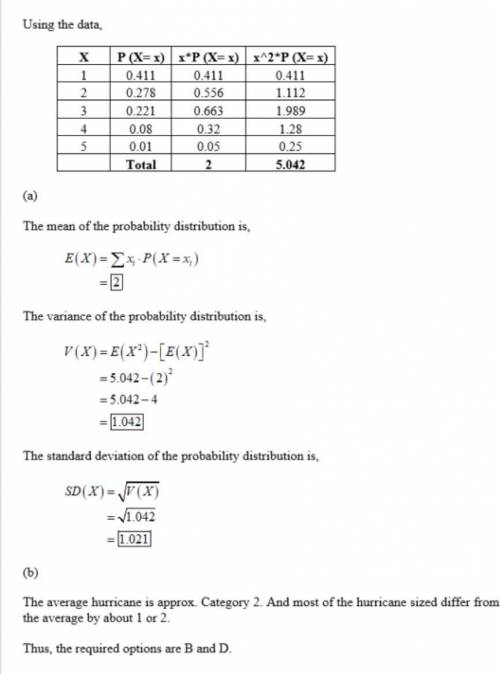
The histogram shows the distribution of hurricanes that have hit a country from 1851 through 2015, where 1 is the weakest level and 5 is the strongest level.
1= 0.411
2=0.278
3=0.221
4=0.080
5=0.010
(a) Find the mean, variance and standard deviation of the probability distribution.
(b) Interpret the results: A, B, C or D.
A. The average hurricane is aprox. category 1.
B. The average hurricane is aprox. category 2.*
C. Most of the hurricane sizes differ from the average by about 2 or 3.
D. Most of the hurricane sized differ from the average by about 1 or 2.*

Answers: 1


Another question on Mathematics
Mathematics, 21.06.2019 12:30
Suppose investors can earn a return of 2% per 6 months on a treasury note with 6 months remaining until maturity. the face value of the t-bill is $10,000. what price would you expect a 6-month maturity treasury bill to sell for? (round your answer to 2 decimal places. omit the "$" sign in your response.)
Answers: 2
Mathematics, 21.06.2019 14:30
The amount of money, in dollars, in an account after t years is given by a = 1000(1.03)^t. the initial deposit into the account was $_^a0 and the interest rate was _a1% per year. only enter numbers in the boxes. do not include any commas or decimal points^t. the initial deposit into the account was $__^a0 and the interest rate is % per year.
Answers: 1
Mathematics, 21.06.2019 18:00
Me, prove a quadrilateral with vertices g(1,-1), h(5,1), i(4,3) and j(0,1) is a rectangle using the parallelogram method and a rectangle method.
Answers: 3
Mathematics, 21.06.2019 20:00
You wanted to draw an enlargement of design that printed on a card that is 4 in by 5
Answers: 1
You know the right answer?
The histogram shows the distribution of hurricanes that have hit a country from 1851 through 2015, w...
Questions

Mathematics, 30.11.2020 14:00
History, 30.11.2020 14:00
Mathematics, 30.11.2020 14:00
Mathematics, 30.11.2020 14:00

English, 30.11.2020 14:00
Mathematics, 30.11.2020 14:00
Mathematics, 30.11.2020 14:00

Biology, 30.11.2020 14:00

Arts, 30.11.2020 14:00
English, 30.11.2020 14:00


