
Mathematics, 12.08.2020 06:01 artiomtyler007
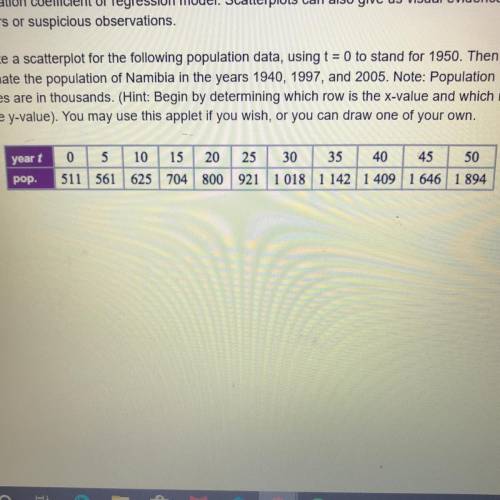
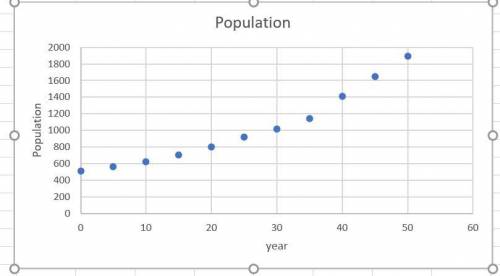
Create a scatterplot for the following population data, using t = 0 to stand for 1950. Then
estimate the population of Namibia in the years 1940, 1997, and 2005. Note: Population
values are in thousands. (Hint: Begin by determining which row is the x-value and which row
is the y-value)

Answers: 2


Another question on Mathematics
Mathematics, 21.06.2019 17:10
The number of chocolate chips in an 18-ounce bag of chocolate chip cookies is approximately normally distributed with a mean of 1252 chips and standard deviation 129 chips. (a) what is the probability that a randomly selected bag contains between 1100 and 1500 chocolate chips, inclusive? (b) what is the probability that a randomly selected bag contains fewer than 1125 chocolate chips? (c) what proportion of bags contains more than 1225 chocolate chips? (d) what is the percentile rank of a bag that contains 1425 chocolate chips?
Answers: 1
Mathematics, 21.06.2019 21:00
Reagan lives five miles farther from school than vanessa lives. write an expression to describe how far reagan lives from school
Answers: 1
Mathematics, 21.06.2019 21:00
The function below show how much jayna and hannah charge for babysitting. which statement best compares the two plants?
Answers: 1
Mathematics, 21.06.2019 23:20
Find the common ratio of the sequence. -4, 8, -16, 32, a: -12b: -2c: 12d: -1/-2
Answers: 1
You know the right answer?
Create a scatterplot for the following population data, using t = 0 to stand for 1950. Then
estimat...
Questions
Mathematics, 07.08.2019 20:10


Chemistry, 07.08.2019 20:10


SAT, 07.08.2019 20:10
History, 07.08.2019 20:10


