
Mathematics, 05.08.2020 16:01 autumperry682
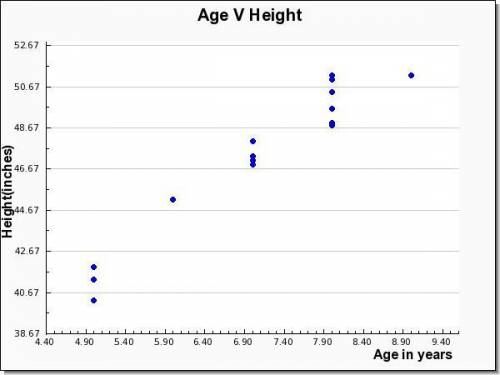
A research center is interested in investigating the height and age of children who are between 5 to 9 years old. In order to do this, a sample of 15 children is selected and the data are given below.
Age (in years) Height (inches)
7 47.3
8 48.8
5 41.3
8 50.4
8 51
7 47.1
7 46.9
7 48
9 51.2
8 51.2
5 40.3
8 48.9
6 45.2
5 41.9
8 49.6
Requried:
a. Develop a scatter chart with age as the independent variable. What does the scatter chart indicate about the relationship between the height and age of children?
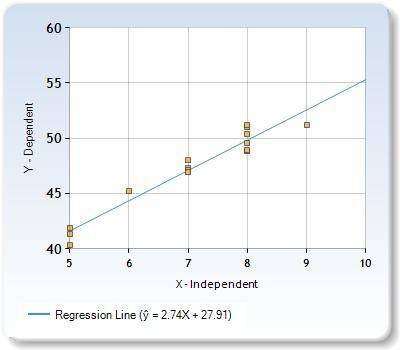
b. Use the data to develop an estimated regression equation that could be used to estimate the height based on the age. What is the estimated regression model?
c. How much of the variation in the sample values of height does the model estimated in part (b) explain?

Answers: 1


Another question on Mathematics
Mathematics, 21.06.2019 14:00
50 points! antonio made a scale model of a building. the model's scale is 1 inch to 235 feet and its height is 3.5 inches. what is the exact height of the actual building? enter your answer in the box.
Answers: 3
Mathematics, 21.06.2019 18:00
Solve 2^x=32 and rewrite this equation in a logarithmic form
Answers: 2
You know the right answer?
A research center is interested in investigating the height and age of children who are between 5 to...
Questions
Mathematics, 27.02.2020 17:59


Mathematics, 27.02.2020 17:59

Computers and Technology, 27.02.2020 17:59

German, 27.02.2020 17:59


