
Mathematics, 12.08.2020 05:01 dookeyb2
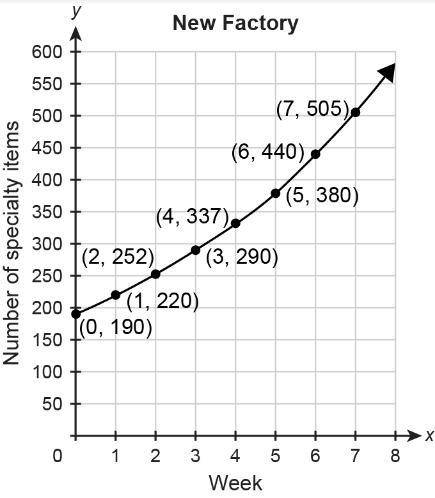
The function represents the number of specialty items produced at the old factory w weeks after a change in management. The graph represents the number of specialty items produced at the new factory a) During Week 0, how many more specialty items were produced at the old factory than at the new factory? Explain. b) Find and compare the growth rates in the weekly number of specialty items produced at each factory. Show your work. c) When does the weekly number of specialty items produced at the new factory exceed the weekly number of specialty items produced at the old factory? Explain.

Answers: 3


Another question on Mathematics
Mathematics, 21.06.2019 17:30
Can someone me and do the problem plz so i can understand it more better
Answers: 2
Mathematics, 21.06.2019 21:00
Mr.zimmerman invested $25,000 in an account that draws 1.4 interest, compouneded annually. what is the total value of the account after 15 years
Answers: 1
Mathematics, 21.06.2019 22:00
If rs 900 amounts to rs 1044 in 4 years, what sum will amount to 1368 in 3 1/2 years at the same rate
Answers: 3
Mathematics, 21.06.2019 23:30
Write a similarity statement for the similar triangles. afgh ~ a
Answers: 1
You know the right answer?
The function represents the number of specialty items produced at the old factory w weeks after a ch...
Questions

English, 05.07.2019 01:30
Mathematics, 05.07.2019 01:30

History, 05.07.2019 01:30
Mathematics, 05.07.2019 01:30
Mathematics, 05.07.2019 01:30
Mathematics, 05.07.2019 01:30


Mathematics, 05.07.2019 01:30

Health, 05.07.2019 01:30
Mathematics, 05.07.2019 01:30
English, 05.07.2019 01:30
History, 05.07.2019 01:30


