Which term describes the red curve in the figure below?
O A. Circle
O B. Parabola
C. El...

Mathematics, 12.08.2020 07:01 vegasherlyn
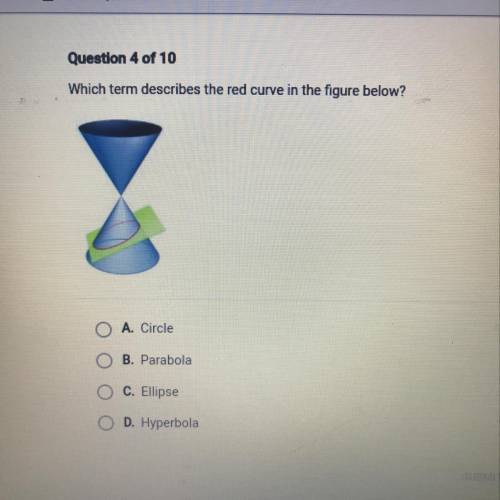
Which term describes the red curve in the figure below?
O A. Circle
O B. Parabola
C. Ellipse
D. Hyperbola

Answers: 3


Another question on Mathematics
Mathematics, 22.06.2019 00:00
An equation in slope-intersept form the lines that passes thought (-8,1) and is perpindicular to the y=2x-17.
Answers: 1
Mathematics, 22.06.2019 00:20
Data for the height of a model rocket launch in the air over time are shown in the table. darryl predicted that the height of the rocket at 8 seconds would be about 93 meters. did darryl make a good prediction? yes, the data are best modeled by a quadratic function. the value of the function at 8 seconds is about 93 meters. yes, the data are best modeled by a linear function. the first differences are constant, so about 93 meters at 8 seconds is reasonable. no, the data are exponential. a better prediction is 150 meters. no, the data are best modeled by a cubic function. a better prediction is 100 meters.
Answers: 2
You know the right answer?
Questions
Engineering, 19.10.2021 22:30

Mathematics, 19.10.2021 22:30
Mathematics, 19.10.2021 22:30
Mathematics, 19.10.2021 22:30

Mathematics, 19.10.2021 22:30
Mathematics, 19.10.2021 22:30

Mathematics, 19.10.2021 22:30

Mathematics, 19.10.2021 22:30


