
Mathematics, 13.08.2020 17:01 queenkimm26
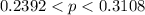
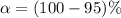
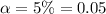
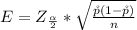
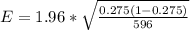
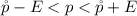
genetic experiment with peas resulted in one sample of offspring that consisted of green peas and yellow peas. a. Construct a % confidence interval to estimate of the percentage of yellow peas. b. It was expected that 25% of the offspring peas would be yellow. Given that the percentage of offspring yellow peas is not 25%, do the results contradict expectations? a. Construct a % confidence interval. Express the percentages in decimal form. nothingp nothing (Round to three decimal places as needed.) b. Given that the percentage of offspring yellow peas is not 25%, do the results contradict expectations? No, the confidence interval includes 0.25, so the true percentage could easily equal 25% Yes, the confidence interval does not include 0.25, so the true percentage could not equal 25%

Answers: 3


 from the normal distribution table is


Another question on Mathematics
Mathematics, 21.06.2019 12:30
How do you multiply a mixed fraction by a regular fraction
Answers: 1
Mathematics, 21.06.2019 16:00
Part one: measurements 1. measure your own height and arm span (from finger-tip to finger-tip) in inches. you will likely need some from a parent, guardian, or sibling to get accurate measurements. record your measurements on the "data record" document. use the "data record" to you complete part two of this project. name relationship to student x height in inches y arm span in inches archie dad 72 72 ginelle mom 65 66 sarah sister 64 65 meleah sister 66 3/4 67 rachel sister 53 1/2 53 emily auntie 66 1/2 66 hannah myself 66 1/2 69 part two: representation of data with plots 1. using graphing software of your choice, create a scatter plot of your data. predict the line of best fit, and sketch it on your graph. part three: the line of best fit include your scatter plot and the answers to the following questions in your word processing document 1. 1. which variable did you plot on the x-axis, and which variable did you plot on the y-axis? explain why you assigned the variables in that way. 2. write the equation of the line of best fit using the slope-intercept formula $y = mx + b$. show all your work, including the points used to determine the slope and how the equation was determined. 3. what does the slope of the line represent within the context of your graph? what does the y-intercept represent? 5. use the line of best fit to you to describe the data correlation.
Answers: 2
Mathematics, 21.06.2019 17:30
Noor brought 21 sheets of stickers. she gave 1/3 of a sheet to each of the 45 students at recess. she wants to give teachers 1 1/2 sheets each.
Answers: 2
Mathematics, 21.06.2019 21:00
If there are 3.281 feet in 1 meter, how many inches are in one centimeter
Answers: 1
You know the right answer?
genetic experiment with peas resulted in one sample of offspring that consisted of green peas and ye...
Questions
Mathematics, 22.04.2020 19:14

Mathematics, 22.04.2020 19:14
Mathematics, 22.04.2020 19:14

Social Studies, 22.04.2020 19:14

Mathematics, 22.04.2020 19:14

Advanced Placement (AP), 22.04.2020 19:14
Mathematics, 22.04.2020 19:14
English, 22.04.2020 19:14
History, 22.04.2020 19:14
History, 22.04.2020 19:14


