
Which linear inequality is represented by the graph?
O y> 2x + 2
Oy2 2x+1
O y> 2x...

Mathematics, 13.08.2020 16:01 paigehixson9457
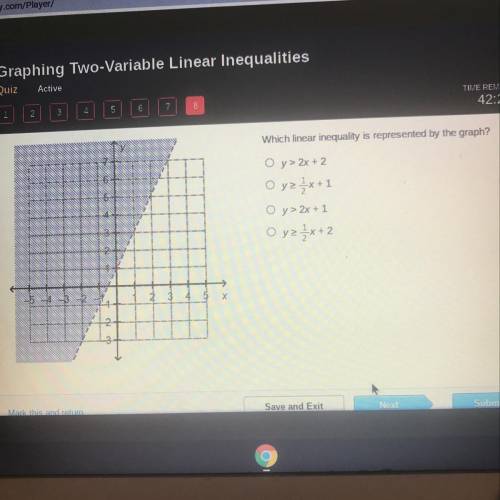
Which linear inequality is represented by the graph?
O y> 2x + 2
Oy2 2x+1
O y> 2x + 1
Oy2x+2
3
6
Х

Answers: 1


Another question on Mathematics
Mathematics, 21.06.2019 14:30
Acommunity group sells 2,000 tickets for its raffle. the grand prize is a car. neil and 9 of his friends buy 10 tickets each. when the winning ticket number is announced, it is found to belong to neil's group. given this information, what is the probability that the ticket belongs to neil? a.1/5 b.1/10 c.1/200 d.1/4
Answers: 2
Mathematics, 21.06.2019 23:00
700 miles the train takes 5 hours to a travel the distance at what unit rate is the train traveling?
Answers: 1
Mathematics, 22.06.2019 00:00
City l has a temperature of −3 °f. city m has a temperature of −7 °f. use the number line shown to answer the questions: number line from negative 8 to positive 8 in increments of 1 is shown. part a: write an inequality to compare the temperatures of the two cities. (3 points) part b: explain what the inequality means in relation to the positions of these numbers on the number line. (4 points) part c: use the number line to explain which city is warmer. (3 points)
Answers: 2
You know the right answer?
Questions


Mathematics, 29.10.2020 16:30
Mathematics, 29.10.2020 16:30


Biology, 29.10.2020 16:40
Mathematics, 29.10.2020 16:40


