
Mathematics, 17.08.2020 01:01 reinasuarez964
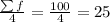
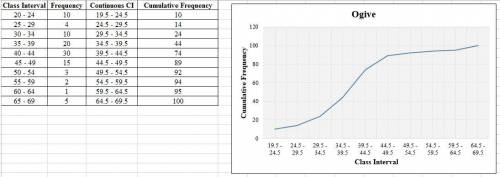
The following table shows scores obtained in an examination by B. Ed JHS Specialism students. Use the information to answer the questions that follow: Score 20-24 25-29 30-34 35-39 40-44 45-49 50-54 55-59 60-64 65-69 Frequency 10 4 10 20 30 15 3 2 1 5.a. Construct a cumulative frequency curve for the data. b. Find the; i. inter-quartile range. ii. 70th percentile class scores. iii. probability that a student scored at most 50 on the examination

Answers: 1
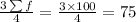
![Q_{1}=l+[\frac{(\sum f/4)-(CF)_{p}}{f}]\times h](/tpl/images/0723/2115/19830.png)
 = cumulative frequency of the previous class = 24
![=34.5+[\frac{25-24}{20}]\times5\\\\=34.5+0.25\\=34.75](/tpl/images/0723/2115/afa09.png)
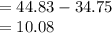
![Q_{3}=l+[\frac{(3\sum f/4)-(CF)_{p}}{f}]\times h](/tpl/images/0723/2115/4a744.png)
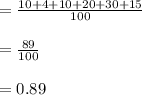
![=44.5+[\frac{75-74}{15}]\times5\\\\=44.5+0.33\\=44.83](/tpl/images/0723/2115/0202c.png)


Another question on Mathematics
Mathematics, 21.06.2019 19:00
What are the solutions of the equation? z^2 + 11z + 24 = 0 a. 8, -3 b. 8, 3 c. -8, -3 d. -8, 3
Answers: 2
Mathematics, 21.06.2019 23:30
Sam opened a money-market account that pays 3% simple interest. he started the account with $7,000 and made no further deposits. when he closed the account, he had earned $420 in interest. how long did he keep his account open?
Answers: 1
You know the right answer?
The following table shows scores obtained in an examination by B. Ed JHS Specialism students. Use th...
Questions
Mathematics, 18.04.2020 10:44


SAT, 18.04.2020 10:44

History, 18.04.2020 10:45
Mathematics, 18.04.2020 10:45
English, 18.04.2020 10:45

Geography, 18.04.2020 10:46
Geography, 18.04.2020 10:46
Mathematics, 18.04.2020 10:46
History, 18.04.2020 10:46
Chemistry, 18.04.2020 10:46
English, 18.04.2020 10:46


