
Mathematics, 16.08.2020 23:01 Raniel
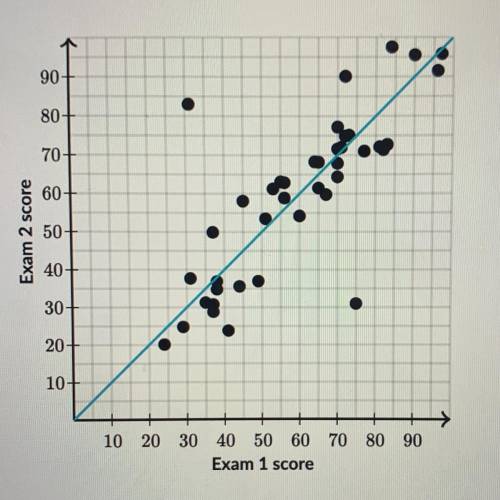
The plot shown below describes the relationship between students' scores on the first exam in a class and
their corresponding scores on the second exam in the class. A line was fit to the data to model the
relationship
Which of these linear equations best describes the give model?
Based on this equation, estimate the score on the second exam for a student whose first exam score was 88.

Answers: 1


Another question on Mathematics
Mathematics, 21.06.2019 20:30
Hi if you want to play a sports related kahoot go to kahoot.it and type in this code: 659344
Answers: 1
Mathematics, 21.06.2019 20:40
The roots of the function f(x) = x2 – 2x – 3 are shown. what is the missing number?
Answers: 2
Mathematics, 21.06.2019 21:30
Are the corresponding angles congruent? explain why or why not.
Answers: 2
Mathematics, 21.06.2019 21:30
On #16 : explain how factoring a trinomial, ax^2+ bx+ c, when a does not equal 1 different from factoring a trinomial when a = 1.
Answers: 2
You know the right answer?
The plot shown below describes the relationship between students' scores on the first exam in a clas...
Questions


Biology, 26.11.2019 23:31

English, 26.11.2019 23:31
Mathematics, 26.11.2019 23:31


