
Mathematics, 17.08.2020 23:01 devonyam7965
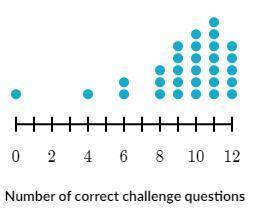
The following dot plot shows the number of weekly challenge questions each of the 30 members the Math Bowl team answered correctly last season. Each dot represents a different member. Which of the following is a typical number of challenge questions one member answered correctly?

Answers: 2


Another question on Mathematics
Mathematics, 21.06.2019 16:30
Aiden buys two bags of chips at $1.09 each and a 20 ounce soda for $1.20 at the gas station.he knows that the state tax is 5.5. how much change will he receive from a $5 bill?
Answers: 1
Mathematics, 21.06.2019 19:30
Your food costs are $5,500. your total food sales are $11,000. what percent of your food sales do the food costs represent?
Answers: 2
Mathematics, 21.06.2019 21:40
Which of the following best describes the graph below? + + 2 + 3 + 4 1 o a. it is not a function. o b. it is a one-to-one function. o c. it is a many-to-one function. o d. it is a function, but it is not one-to-one.
Answers: 3
You know the right answer?
The following dot plot shows the number of weekly challenge questions each of the 30 members the Mat...
Questions
Mathematics, 03.12.2021 19:20
Mathematics, 03.12.2021 19:20


History, 03.12.2021 19:20


Mathematics, 03.12.2021 19:20

Computers and Technology, 03.12.2021 19:20
Mathematics, 03.12.2021 19:20
Computers and Technology, 03.12.2021 19:20
Mathematics, 03.12.2021 19:20

Chemistry, 03.12.2021 19:20
Mathematics, 03.12.2021 19:20


