
Mathematics, 18.08.2020 20:01 wonderwonder2748
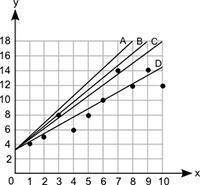
Which line best represents the line of best fit for this scatter plot? Graph shows numbers from 0 to 10 at increments of 1 on the x axis and numbers from 0 to 18 at increments of 2. Scatter plot shows ordered pairs 1, 2 and 2, 6 and 3, 4 and 4, 10 and 5, 8 and 6, 8 and 7, 12 and 8, 10 and 9, 12 and 10, 14. A line labeled P joins ordered pair 0, 2.4 and 9, 18. A line labeled Q joins ordered pairs 0, 2.4 and 10, 18. A line labeled R joins ordered pairs 0, 2.4 and 10, 13.6. A line labeled S joins ordered pairs 0, 2.4 and 10, 10. Line P Line Q Line R Line S

Answers: 1


Another question on Mathematics
Mathematics, 21.06.2019 20:30
Joe has some money in his bank account he deposits 45$ write an expression that represents the amount of money in joe's account
Answers: 2
Mathematics, 21.06.2019 23:00
Shared decision making is always a positive strategy to take
Answers: 1
You know the right answer?
Which line best represents the line of best fit for this scatter plot? Graph shows numbers from 0 to...
Questions
Mathematics, 06.10.2019 04:30
Mathematics, 06.10.2019 04:30

Health, 06.10.2019 04:30

Mathematics, 06.10.2019 04:30
Mathematics, 06.10.2019 04:30
Health, 06.10.2019 04:30
Business, 06.10.2019 04:30

Biology, 06.10.2019 04:30
Mathematics, 06.10.2019 04:30

Mathematics, 06.10.2019 04:30
Chemistry, 06.10.2019 04:30


