
Mathematics, 18.08.2020 22:01 jjjoooorrrrddddaannn
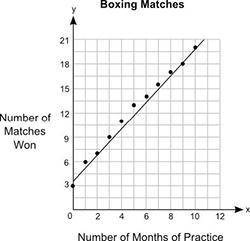
The graph below shows the relationship between the number of months different students practiced boxing and the number of matches they won: The title of the graph is Boxing Matches. On x axis, the label is Number of Months of Practice. On y axis, the label is Number of Matches Won. The scale on the y axis is from 0 to 21 at increments of 3, and the scale on the x axis is from 0 to 12 at increments of 2. The points plotted on the graph are the ordered pairs 0, 3 and 1, 6 and 2, 7 and 3, 9 and 4, 11 and 5, 13 and 6, 14 and 7, 16 and 8, 17 and 9, 18 and 10,20. A straight line is drawn joining the ordered pairs 0, 4 and 2, 7.1 and 4, 11 and 6, 13.5 and 8, 17 and 10, 20.5. Part A: What is the approximate y-intercept of the line of best fit and what does it represent? (5 points) Part B: Write the equation for the line of best fit in the slope-intercept form and use it to predict the number of matches that could be won after 13 months of practice. Show your work and include the points used to calculate the slope. (5 points)

Answers: 3


Another question on Mathematics
Mathematics, 21.06.2019 18:00
Darian wants to build a regulation size pool table that is 9 feet in length.he plans he ordered are 18 by 36 inches. what is the scale factor of the dilation he must use to build a regulation pool table
Answers: 1
Mathematics, 21.06.2019 19:30
Your food costs are $5,500. your total food sales are $11,000. what percent of your food sales do the food costs represent?
Answers: 2
Mathematics, 21.06.2019 19:30
Need now max recorded the heights of 500 male humans. he found that the heights were normally distributed around a mean of 177 centimeters. which statements about max’s data must be true? a) the median of max’s data is 250 b) more than half of the data points max recorded were 177 centimeters. c) a data point chosen at random is as likely to be above the mean as it is to be below the mean. d) every height within three standard deviations of the mean is equally likely to be chosen if a data point is selected at random.
Answers: 1
You know the right answer?
The graph below shows the relationship between the number of months different students practiced box...
Questions
Mathematics, 07.10.2020 18:01

Chemistry, 07.10.2020 18:01


English, 07.10.2020 18:01
Mathematics, 07.10.2020 18:01
Mathematics, 07.10.2020 18:01


Law, 07.10.2020 18:01
History, 07.10.2020 18:01
Mathematics, 07.10.2020 18:01
Mathematics, 07.10.2020 18:01
Mathematics, 07.10.2020 18:01


